Every FRC team is familiar with the FRC Driver Station software. It’s the tool we use to drive our robots, whether in competition or back at the shop. Any serious driver will have tested every tab and button on this program. Hopefully, they’ve also read the documentation.
When you installed the driver station, you also got the Driver Station Log Viewer. The driver station records a lot of information about every driving session, whether in competition or in practice. I know that some teams make use of the log viewer, but many never touch it, or only open it up when they’re in trouble. Learning to use it will definitely upgrade your control systems diagnostic skills.
Introducing the log viewer
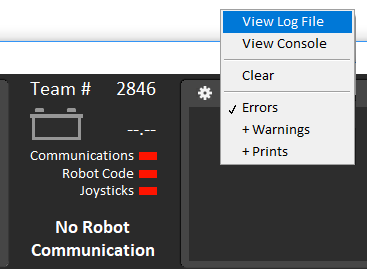
You can find the log viewer program installed in c:\PROGRA~2\FRCDRI~1, but the easy way to start it is directly from the driver station. Click on the gear icon and select “View Log File”.
The log viewer will pop up.
In the upper left part of the screen you’ll see a list of all matches and test runs that this driver’s laptop has witnessed, along with the log’s time in seconds. If you were connected to a competition’s Field Management System, it will display the match name and number. The driver station starts logging data as soon as it connects, which may be several minutes before your match starts. FRC matches are always 150 seconds, but most log files contain the pre-match time as well. If the time is less than 150 seconds, there was probably an error that truncated the log.
Below the log file list is the log directory. You may switch to another directory if you have a collection of log files from another drive’s laptop.
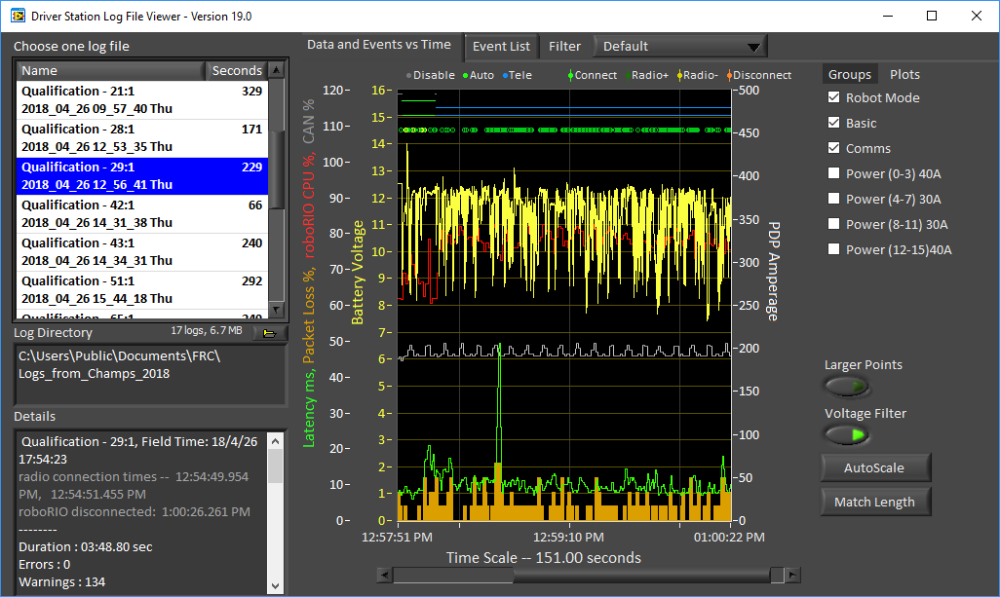
In the middle of the window you will see the graph of your robot’s critical parameters. Get familiar with the different parameters, their different scales on the left, and the time scale along the bottom.
By dragging a selection on the graph you will zoom in to take a closer look at the data. Once you’ve started zooming you can use the scroll bar at the bottom to move forwards and backwards in time. Note the blue and green lines at the top of the graph; if you zoom in enough they will become individual dots, spaced out at 50 readings per second. Robot communication runs at 50 cycles per second, so each dot represents one reading. Note that occasionally a dot will be missing, indicating a lost network packet. You can zoom back out to the full graph by hitting the “AutoScale” button.
Hitting the “Match Length” button will zoom the graph to exactly 150 seconds. Then use the scroll bar to position the upper green line on the left edge of the display.
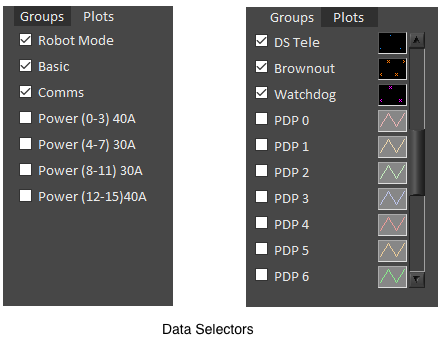
The checkboxes on the upper left let you toggle different parameters. You can turn off some lines to get a better look at others. Or, you can turn on fine grained data, such as the electrical current on each PDP channel. There are two tabs organizing the selectors, either by major groups or by individual plots.
Move your cursor over the graph while watching the Details box in the lower left corner of the window. Message details will give you additional insight into the graph parameters.
A basic log review procedure
Start reading your logs regularly, and you’ll get a sense of what good and bad logs look like for your robot.
Sometimes, you will need to look at the logs of a stranger’s robot. During a competition, it’s pretty common for the FTA to call up one of the CSAs and say “Something weird happened to that team’s robot. Go check their logs”. The following is a basic procedure for evaluating a robot log:
- In the upper left corner, select the log file corresponding to match in question. It’s easy to get the wrong match, so pay attention to the time stamps. Glance at the graph and then click on a match or two prior to this one for comparison:
- Watch for notable differences in the yellow voltage line on the different graphs. If the voltage in one match dips much lower, it may indicate a bad battery.
- Watch the green network latency line or the orange packet loss lines. If network communication is bad in just one match there may be a problem with another robot, or some radio interference occurred during that match. If network communication is always bad, your radio might be poorly positioned or might be malfunctioning. Radios should be mounted horizontally and not be surrounded by metal.
- Reselect the match in question. Look for any gaps in the graph that would indicate that something failed. A roboRIO reboot creates a gap of about 10 to 15 seconds. At the time of this writing, a radio reboot creates a gap of between 35 and 45 seconds. (Future radios will behave differently.) A loose network cable will produce a gap of random length.
- Select the “Match Length” button and scroll until the green lines at the top are at the left edge. Now you are seeing the full match on screen.
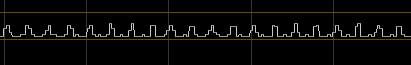
- The blue and green lines at the top of the graph are the “Robot Mode” indicators.
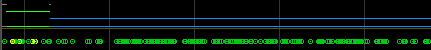
- The green lines on top are the autonomous period and blue lines are the teleoperated period. You may notice a tiny gray line between green and blue indicating that your robot was in disabled mode for an instant.
- The blue and green lines on top were transmitted from the robot, and they indicate what your robot thought the operating mode was. Below these lines are the DS mode lines, indicating the operating mode of the driver station.
The robot mode lines should match the DS mode lines and there should be no gaps.
- Below the mode lines is a row of dots which are event markers in the Event List. If you trace your cursor across the dots the text messages will appear in the Details window.
- The green, yellow and red markers are log messages generated by the underlying WPILib framework. Also, anything your robot code prints will appear as a marker dot.
- You might see brown markers, indicating a brownout event, indicating that the robot voltage fell below 6.8 volts.
- You might see purple watchdog markers, indicating that a MotorSafety object has gone too long without a signal, and has therefore been disabled temporarily.
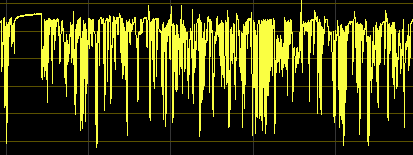
- The big yellow graph is the battery voltage as recorded at the PDP. Voltage should vary in the range between 12.5 and 8 volts. Take note of the voltage before the match; a starting voltage below 12 indicates that an uncharged battery was installed.
If there are times in the match were the robot stops for a moment, the graph will go flat. If the voltage goes too low, the robot may experience a brownout. Different batteries may go lower or may lose voltage quicker.
- The red line shows the roboRIO CPU utilization. I have never seen a problem with this graph, but a spike here might indicate that excessive processing is taking place, and might cause a watchdog error.
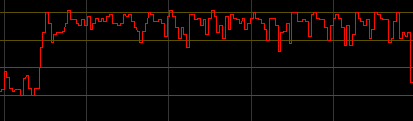
Interestingly, autonomous code usually requires less CPU than teleoperated code. - A gray line shows the traffic load on the CAN bus. I have never seen a problem with this and it’s always a uniformly jaggy line.
- The green and yellow lines at the bottom of the graph are the “Comms” group of statistics. They show the health of your network communication. Spikes in these graphs are common, so don’t worry unless you see bad network traffic for more than a couple seconds.
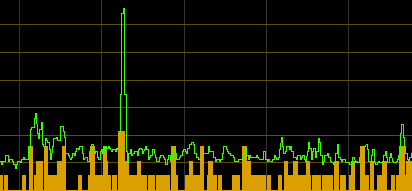
- The green line shows network latency measured in milliseconds. Hover your cursor over the lines to see the exact values.
Typical trip times will be in the range of 5 to 20 ms. Spikes of up to 60 ms are common. - The orange line shows network packet loss in average packets lost per second.
Losing 3 to 5 packets per second is pretty common.
- The green line shows network latency measured in milliseconds. Hover your cursor over the lines to see the exact values.
- You can also view graphs of the current from the PDP. You can enable groups of channels (such as channels 0 through 3), or individual PDP channel plots. You may need to trace PDP channels back to specific motors to understand the output.
Spikes in current may indicate motor stalls. Watch for conditions where circuit breakers tripped. Try comparing similar motors, such as the drive train motors, to see if any channel looks significantly different. - At the top of the window is a tab labeled “Event List”. Selecting it switches the display to show the text logs generated during your match. Each line in this display corresponds to one of the “event marker” dots we discussed earlier.
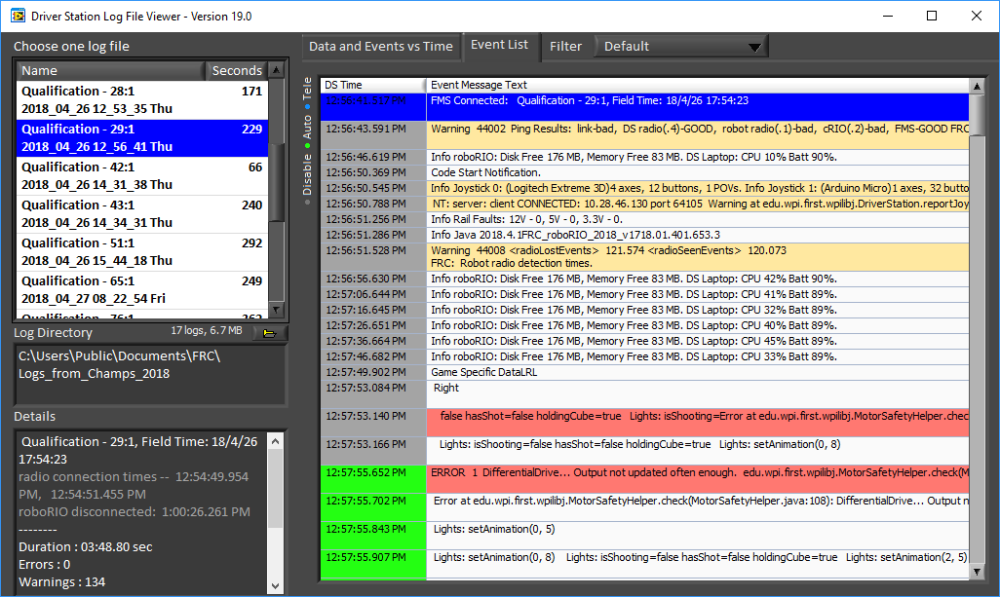
There’s a lot of color coding in this display. The timestamps on the left are colored gray or green or blue denoting the disabled / autonomous / teleop modes. Any line containing the word “warning” will be colored orange and any line containing “error” will be red.- If you had seen a problem in the data graph display, you can look at the events list for the same time period, to get clues about what happened.
- The list will contain messages from roboRIO. There are informational logs about memory and disk capacity. Pay especial attention to orange warning messages about “Ping Results”; they tell you robot components were working, helping you diagnose network communication problems. If your robot ever throws an Exception, it will be displayed as a red error message.

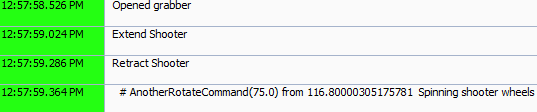
- Your robot software can also generate event logs. Anything that your code prints to standard output will appear in the events logs. You may choose to print out messages about what the robot is doing. Print out when the robot does important things or when any commands are executed. Print out your air pressure or some specific states your robot goes into. This can be useful in general, but especially valuable when diagnosing an error condition.
In 2018’s game, the FMS transmitted random game data at the beginning of each match, which many teams used to pick different autonomous routines. Printing out the game data and the autonomous choices was useful for post-match analysis.
Specific problems to investigate
Brownouts
One of the most important problems you can find in the logs are brownout conditions, where the voltage falls too low. When the voltage starts falling below 6.8 volts, the roboRIO will protect its own existence by disabling motor outputs.
- The most common cause of brownouts is bad batteries or uncharged batteries. Note if brownouts correlate to certain batteries.
- Brownouts may also be caused by shorts and loose connections. In particular, look for loose wires on the battery connections, the main breaker connections, and all the PDP connections.
These brownouts may happen in every match. They may correlate to violent actions. Pull test all connections and otherwise check over the wiring. - Binding in the system may cause brownouts. Reduce the friction on everything.
- Too many motors can consume too much current. See if brownouts correlate to actions that use many motors. Consider increasing the ramp rate of your motor controllers. Ramp rate is measured in the time it takes to go from no power to maximum power.
About motor safety / watchdog errors
One message you may see in the event logs or on the console is “Output not updated often enough”, which indicates that one of your motors is not getting signals often enough. Drive motor controllers are MotorSafety objects, and they will shut the motors down if they aren’t constantly fed signals. This message usually means that some other part of your software is taking too much time.
Further Reading:
- Log Viewer documentation on Screen Steps Live
- DS Log Viewer video with Kevin O’Connor.
