Tutorial

Debugging: Java Remote debugging

So far you’ve probably been debugging Java code by adding print statements;  you add code that gives you a peek into the robot’s internal state.  Monitoring the robot with ShuffleBoard is similar;  you add output statements to your code.

Imagine a better system that doesn’t require added code, where you could stop time, crack the roboRIO open and see what was going on inside.   You could examine the variables and then watch the lines of code execute, one at at time.  This technique, called Remote Debugging, is available to you from most modern Java development environments.

Remote debugging lets us answer questions like “Did my code even get executed?” or  “Did the initialization code really get executed before the periodic code?” or “What were the variable values?”.   Since the the debugger can let you see the actual execution, you can also verify that conditionals and loops really execute the way you expect.  You can even use the debugger to alter variable values, so novel scenarios can be tested.

We call this technique “remote” debugging because it involves a network connection between your programming laptop and the roboRIO.  Your robot program is executing on the RIO, but it will be controlled and monitored by the development environment on your laptop.  You’ll be watching the action as if it’s happening on your screen, but the action is actually occurring remotely on your robot.

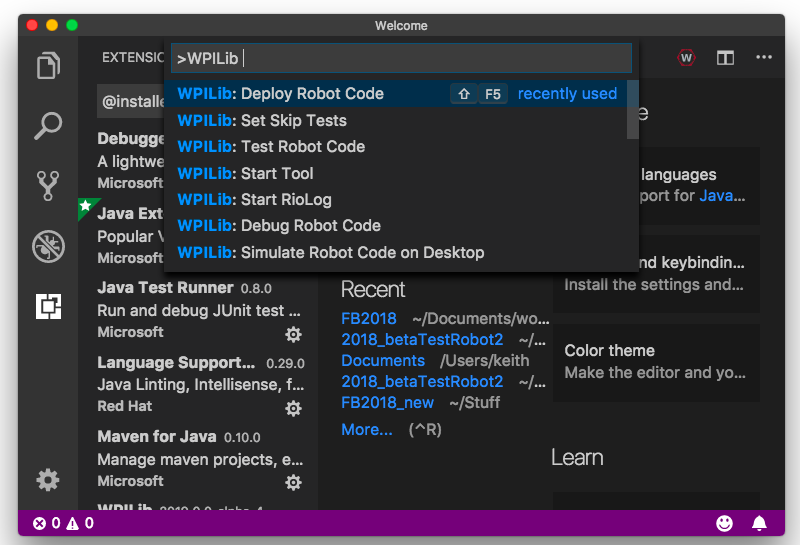
Starting the debugger is almost the same action as deploying code with GradleRIO.  Execute the “debug” command instead of “deploy”:

debug_remote_menu

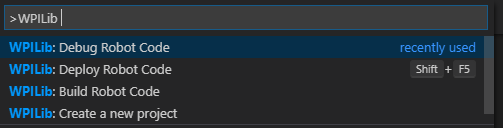
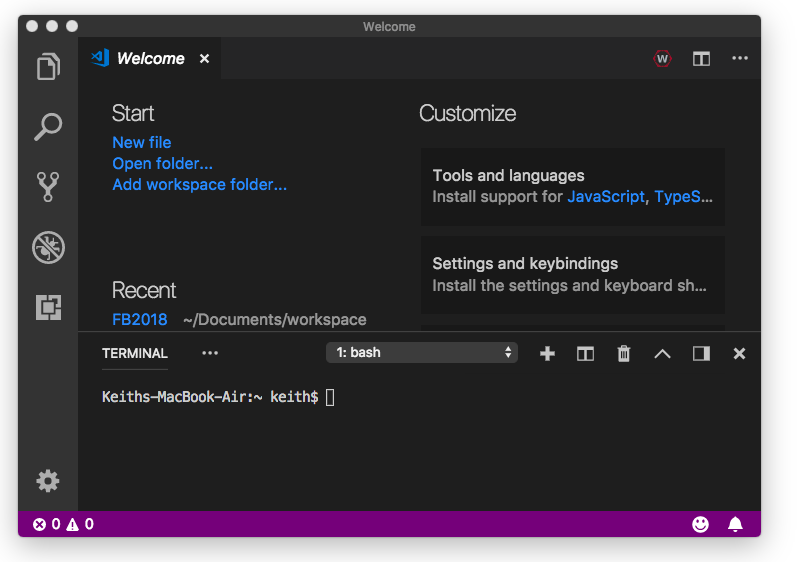
This command will build and deploy code in debug mode which will configure the RIO to communicate back to your debugger.  Visual Studio Code will also switch into debug mode (as indicated by the Debug icon in the activity bar on the left edge of the window).

Breakpoints

The first important concept in remote debugging is the setting of “breakpoints” in your program.  A breakpoint is a location in your program that you want to watch.   When your robot’s thread of execution reaches that point, the program will freeze and your debugger will come alive.

Inline breakpoints

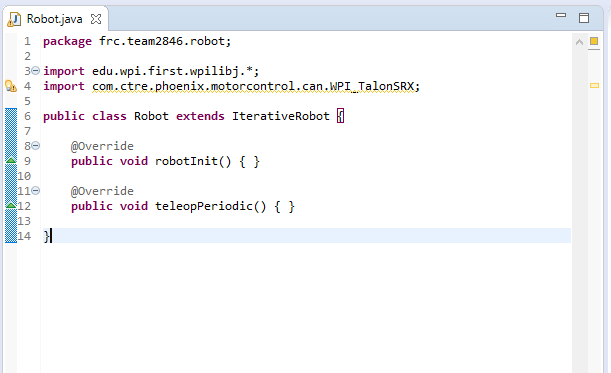
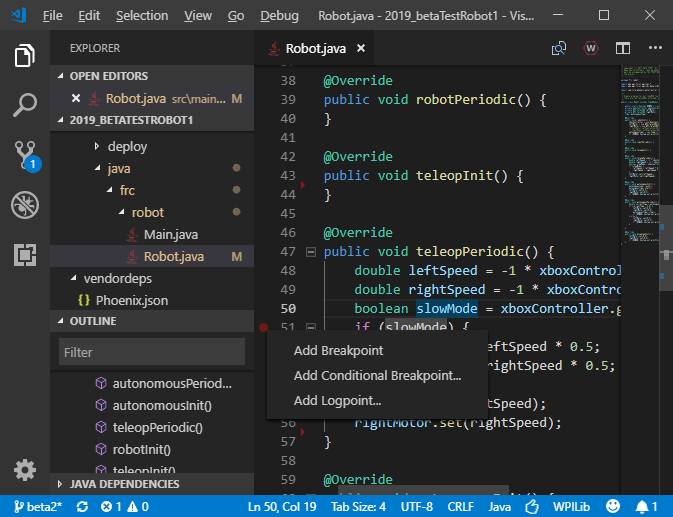
To create a breakpoint, click to the left of the line numbers in your program.  Below, we’ve created a breakpoint on line 51 of the teleopPeriodic method, indicated by a little red dot:

debug_remote_normal_breakpoint.png

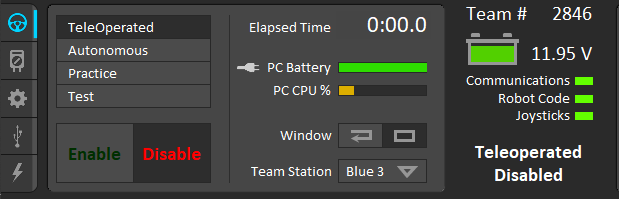
Start the Driver Station software and enable teleop mode.  The normal execution of a robot program is that the RIO will execute teleopInit once and then start executing teleopPeriodic.   When the RIO reaches the breakpoint on line 51, it will pause execution as below:

debug_remote_debug_mode

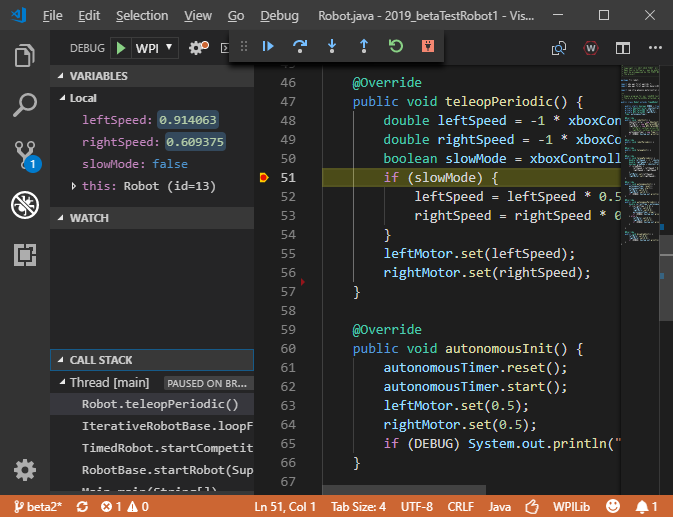
There is a lot of information going on in this window:

  • In the upper left sidebar you see all the local variables of the teleopPeriodic method, There’s also the “this” variable that you can expand to see all the Robot’s instance variables.
  • Below the Variables section is the Watch section, which lets you add arbitrary expressions to be evaluated.
  • In the lower left of the sidebar is the Call Stack, which tells you what method called your current method, and what method called that method, etc.  The call stack actually lists all the Java threads currently running on the RIO, but you may have to stretch out the window to see them all.
  • Below the Call Stack, there is a list of Breakpoints.  In the above illustration, you would need to collapse the call stack to see the breakpoints.  You can edit or enable/disable breakpoints here.
  • Above the editor window is the debug toolbar:

debug_remote_toolbar.png

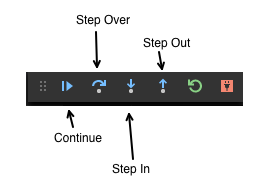
The “Continue” tool will cause program execution to resume, until it reaches the next breakpoint.  The “Step Over” tool executes the next line of code.  “Step in” will drill into a method. “Step out”  pops out of the current method to the method in the call stack that called it.  At every step, you can watch the variables change.  You’ll be able to see the code go through “if” statements and loops.

Also, take a look at the “Debug” menu at the top of the window.  Particularly useful in the Debug menu are options to temporarily disable all breakpoints and then later enable all breakpoints.  Disabling breakpoints lets you perform normal robot operations for a while.  Then you can enable breakpoints to examine specific scenarios.

Conditional breakpoints

Note that in our above example, we encounter the breakpoint every single time we execute teleopPeriodic.  We could have put the breakpoint inside the “if” statement, in which case the breakpoint would stop only when the “slowMode” variable was true.

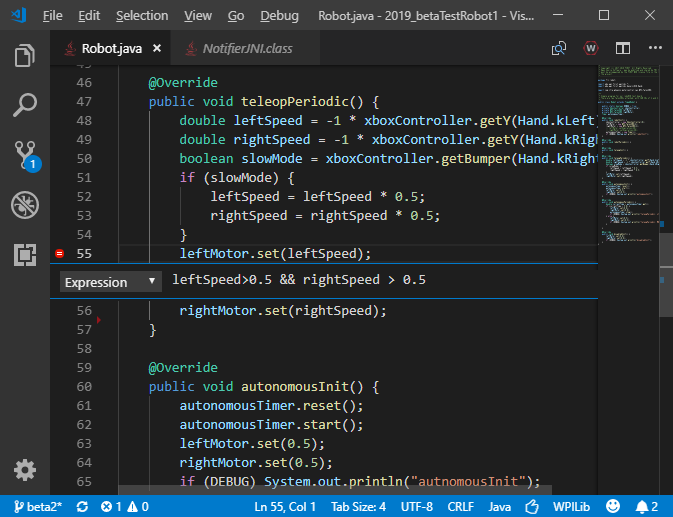
It is often useful to set “conditional” breakpoints that only fire when certain conditions arise.  The conditional breakpoint is indicated by a little red dot with an equals sign in it.  Create one by right-clicking to the left of the line number and specify “Add Conditional Breakpoint”.

For instance, below we have a  breakpoint on line 55 that only fires when both leftSpeed and rightSpeed are greater than 0.5.

debug_remote_conditional_breakpoint

Exception breakpoints

You can also specify that the debugger stops operation when an exception is thrown.  Look in the Breakpoints section at the bottom of the Debug sidebar and enable “Caught Exceptions”.  Exception breakpoints can be especially useful when you’re trying to diagnose unexpected exceptions.

Note that VS Code will break on all exceptions.  Other IDEs allow you to break on specific exception types.

Logpoints

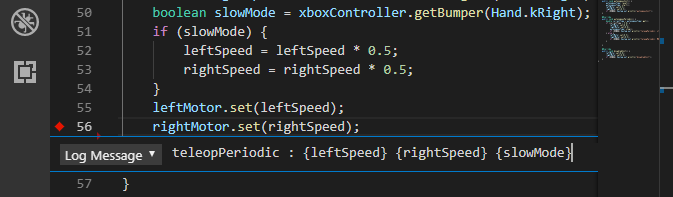
A logpoint is like a breakpoint, but it merely prints a message out to the console instead of stopping.  This is like debugging with print statements, except that you can enter them in the debugger without having to recompile.  Create one by right-clicking to the left of the line number and specify “Add logpoint”.  Logpoints are indicated by a little red diamond.

You can cause logpoints to print out variable values by putting the variables in curly braces.  Below is a logpoint that will print out three variables:

debug_remote_logpoint.png

Examining program state

The Variables section of the debug sidebar will answer many of your questions about what’s going on inside your program.  Spend time exploring the local and instance variables to see what’s in the objects.  Familiarize yourself with the state of health programs so you can better spot error conditions.

The Variables section also allows you to change the values of variables.  Just double-click on any number, boolean, or String value and you can give it a new value.  This feature can let you test specific scenarios, such as “What will happen if my gyro returns a negative value?”.

If you are monitoring specific variables or variable expressions, park them in the Watch section.  They will be reevaluated whenever the program stops.  You can add expressions directly in the Watch section, or you can right-click on them in the code editor and select “Debug: Add to Watch”.

Debugging robot programs with Eclipse

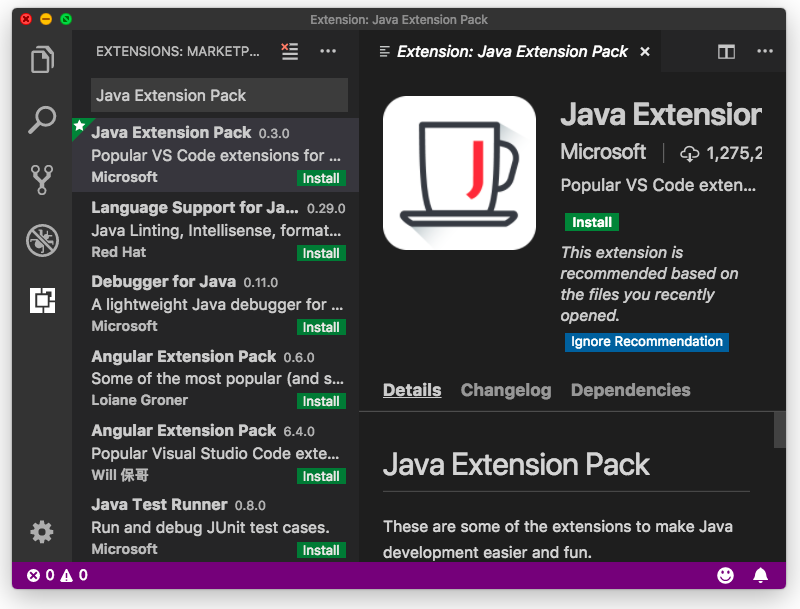
The program on your robot is running within a Java Virtual Machine (JVM).  Remote debugging is possible because JVMs contain features to support it.  The mechanism for debugging is called the Java Platform Debugger Architecture (JPDA).    Visual Studio Code has an extension that connects to JPDA, but so does nearly every other Java development environment.  The debugging functions will be similar on other IDEs, but the user interface may be different.

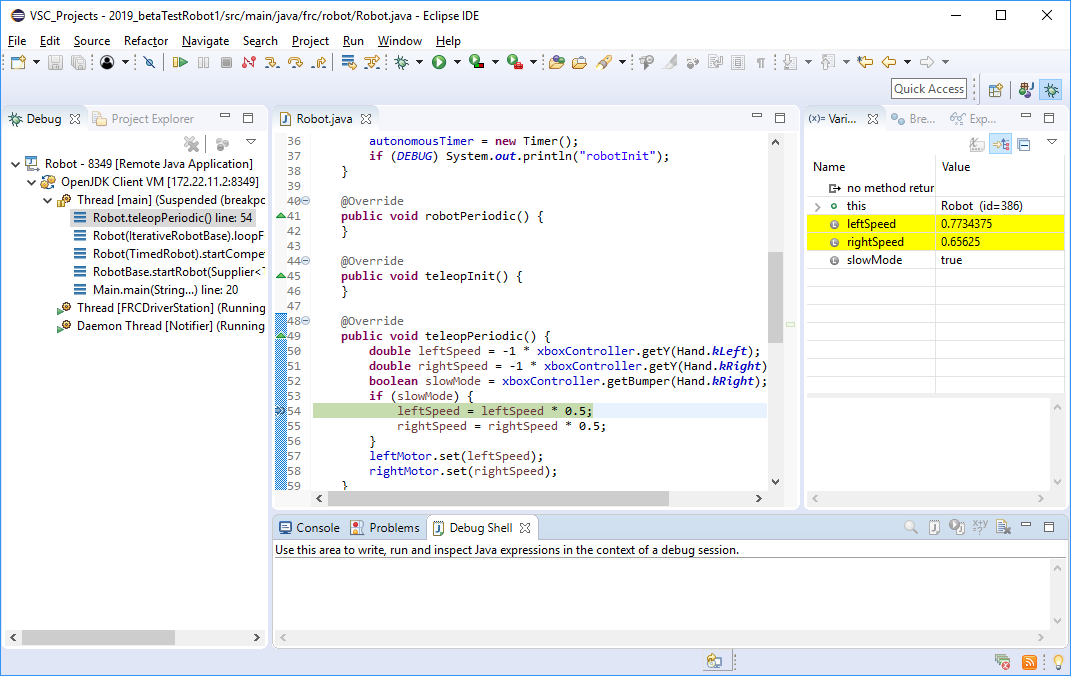
Eclipse has an excellent built-in Java debugger.  The user interface is different from VS Code, but (in my opinion) it makes better use of you screen space.

debug_remote_eclipse_3.png

Eclipse’s Gradle plugin allows you to execute the GradleRIO deploy task.  Enabling remote debugging is a slight variation on the deploy task.

  1. Go to the Gradle Tasks view and find embeddedtools > deploy.  Right-click on the deploy task and select “Open Gradle Run Configuration”.
    debug_remote_eclipse_1a.png
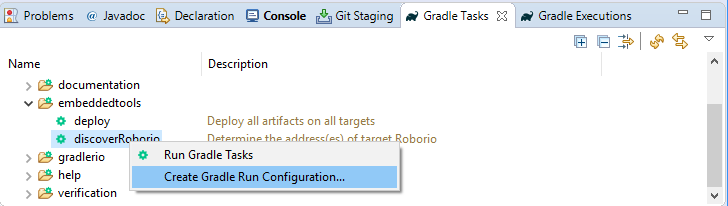
  2. The Run Configuration dialog will pop up for the “deploy” task.
    debug_remote_eclipse_1b
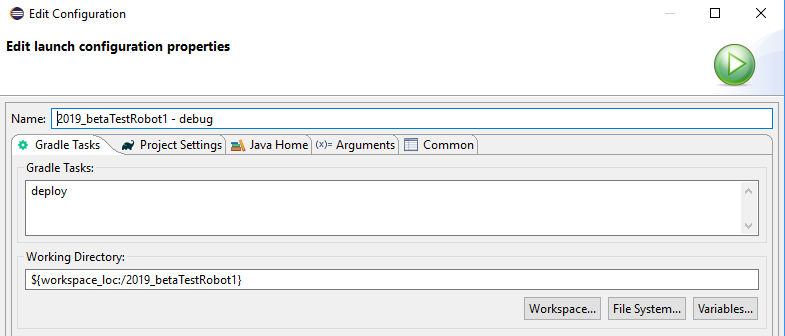
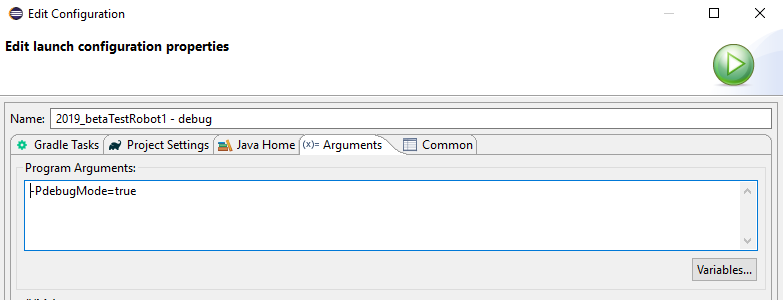
  3. Click on the Arguments tab and add the debugMode project property.  Then hit the OK button to save.
    debug_remote_eclipse_1c
  4. Next, you’ll need to set up a Remote debugging configuration.  From the Run menu, select “Debug Configurations…”
    In the Debug Configuration dialog, add a new entry under “Remote Java Application”.
    debug_remote_eclipse_2
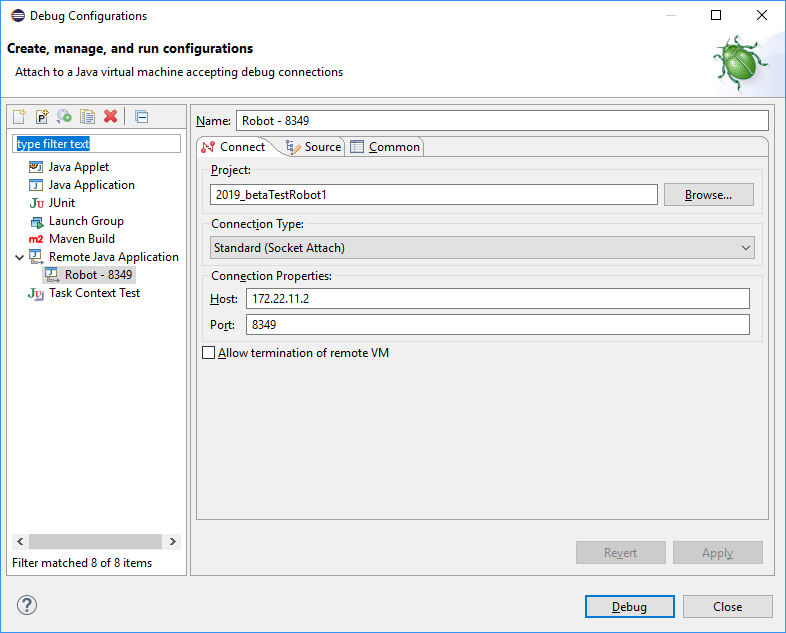
    Specify a host address that will connect to your roboRIO (either 10.te.am.2 or 172.22.11.2) and set the port number to 8349.

To do remote debugging in Eclipse, you will first deploy the code in debugMode using your new run configuration.  Then, you will attach to the remote process with your new debug configuration.

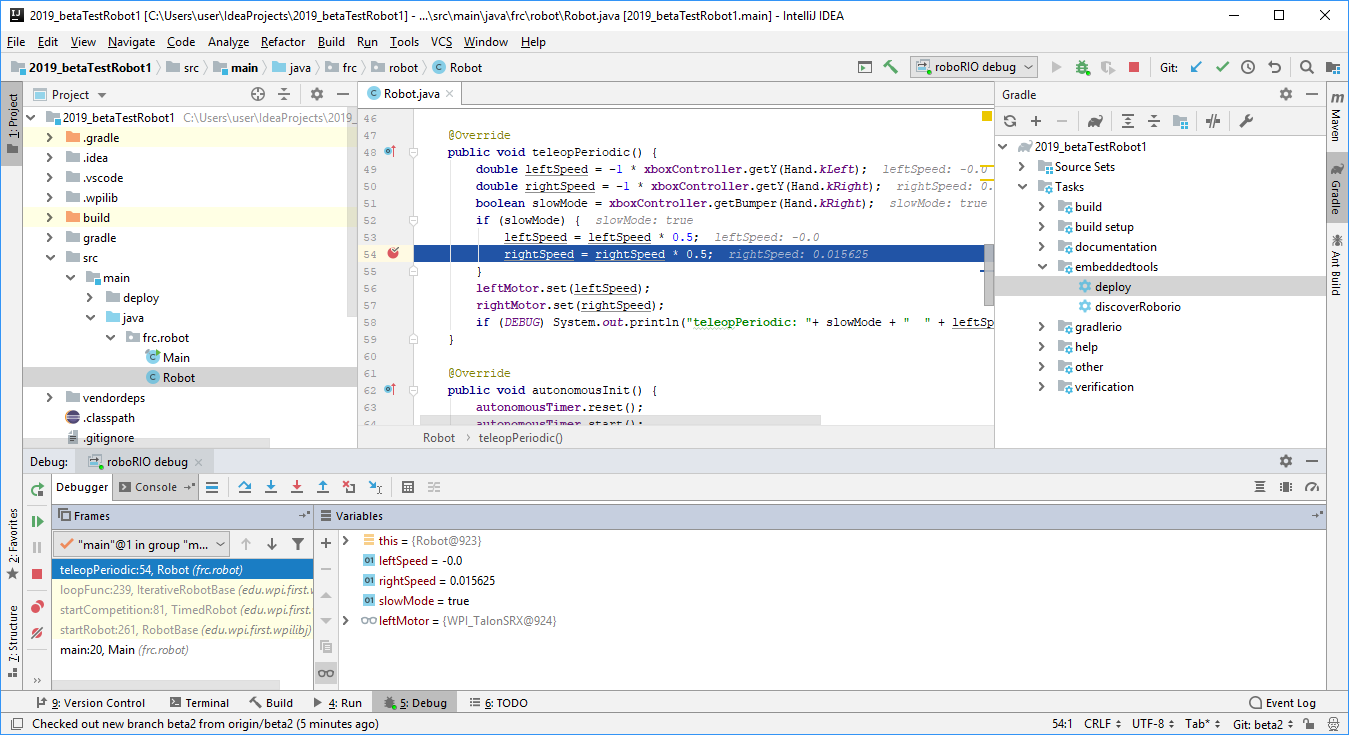
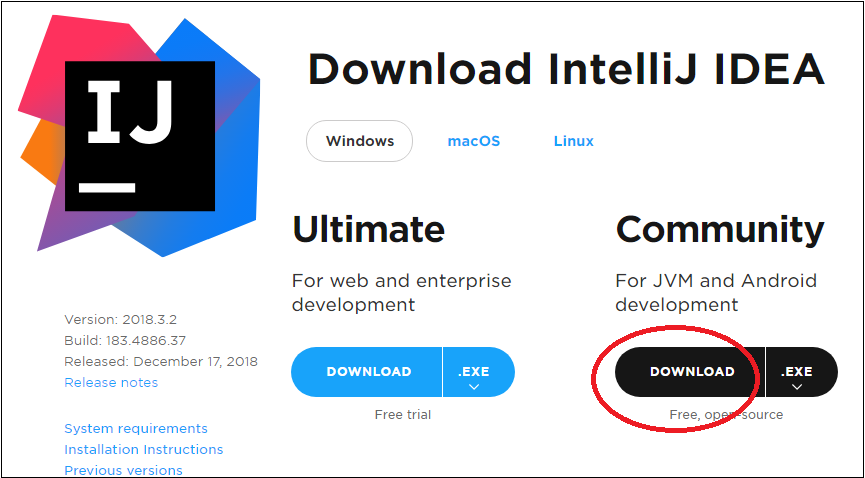
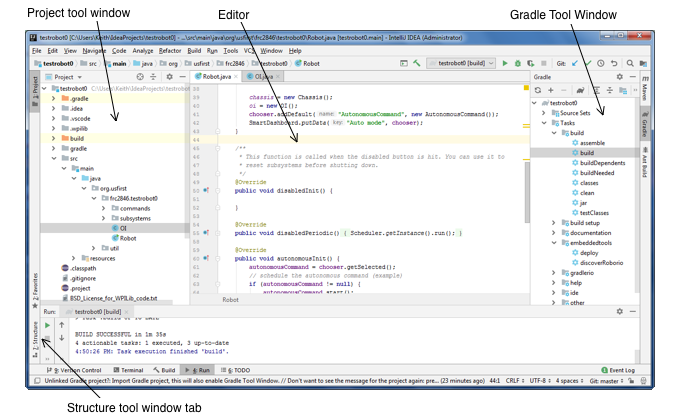
Debugging robot programs with IntelliJ

IntelliJ also an excellent Java debugger.  It is built-in, no extension needed.  The function and user interface is similar to Eclipse.

debug_remote_intellij_3

To set up remote debugging in Intellij:

  1. From the Run menu, select “Edit Configurations…”
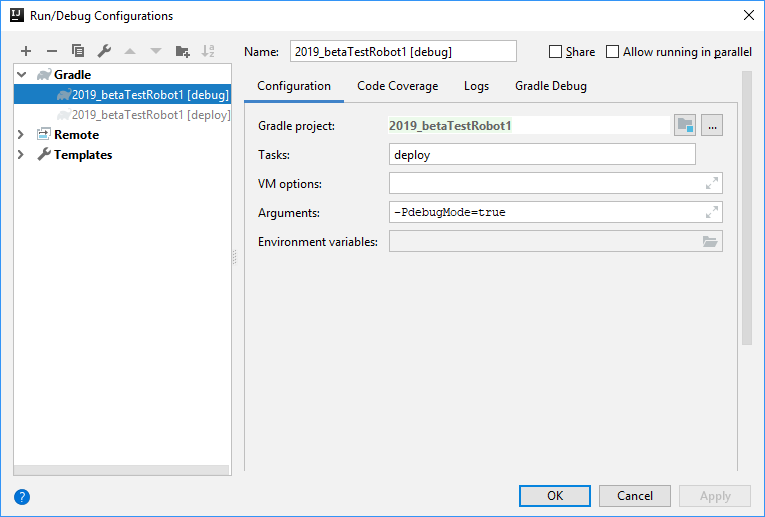
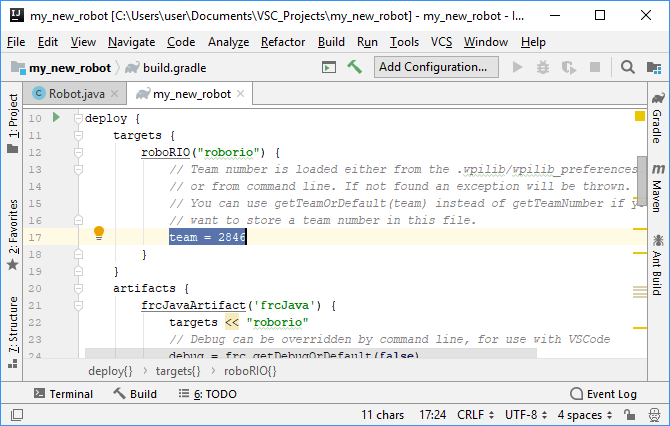
  2. Create a Gradle configuration with a task of “deploy” and arguments turning on the debugMode
    debug_remote_intellij_1
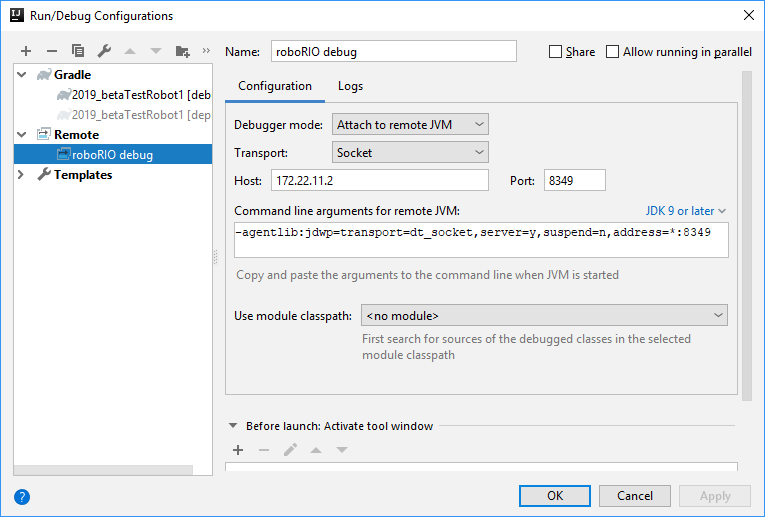
  3. In the same Run/Debug Configurations dialog, create a new Remote configuration for port 8349 and for a host address that connects to your roboRIO.
    debug_remote_intellij_2

To do remote debugging in Intellij, you first deploy the code using your new deploy configuration.  Then, attach to the RIO using the new Remote configuration.

When not to use the Debugger

There are times when the debugger isn’t the right tool.   Robots operate in real-time, so freezing time disconnects them somewhat from real-world processing.    For instance, if you are debugging while motors are moving, stopping the action will the change the physics of your situation.  If you stop a command that has a timeout, the timeout may expire while you’re staring at the code, which change the robot’s behavior.  If you’re investigating at problem related to real-time interactions, you may choose to set logpoints or to use printing, logging, or ShuffleBoard instead.

Overall though, I hope this exercise has sold you on the use of the debugger.  It will be a tremendously useful tool for problem solving.  All serious programmers should learn to use the remote debugger.
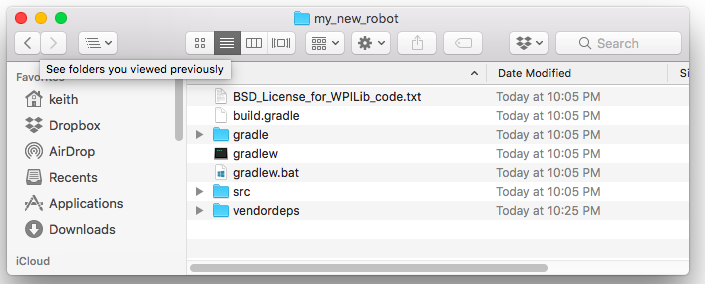
Further Reading:

Tutorial

Creating Java Programs with IntelliJ

Creating GradleRIO FRC robot programs in IntelliJ is quite easy.

Step 0: The prerequisites

At this point you should already have installed Java and set up IntelliJ.

You must be connected to the internet the first time you build the project.  After the first build, you can build in offline mode.

Also, you should obtain and run the WPILib one-step installer (available at the beginning of the 2019 season).  Even if you’ll be developing with InteliJ,  you’re likely to need the tools and project templates included in this package.

Step 1: Create a new Robot Project

There are currently several ways to create a basic WPILib robot project:

  • Create a new robot project with VS Code using the WPILib extension.
  • Create a project with RobotBuilder.  You will need a recent version of RobotBuilder that generates GradleRIO projects.  The 2019 software release will contain all new tools, including RobotBuilder.  Or, you can build the latest version from GitHub.
    RobotBuilder creates a full command-based project, so it may be more complicated than what is described in Step 3 below here.
  • Uncompress a copy of the Quickstart.zip file and make a copy of the “java” directory.  Rename the directory to whatever you like.

Now, whichever method you use, add an empty directory called “vendordeps”.   Your project should now look like this:

intellij_program_files

Inside IntelliJ, open the File menu and select File > Open.  Select your project root directory and hit the “OK” button. The “Import Gradle” dialog will appear. Hit “OK” again and open the project in the current window.   The “Gradle” tool window on the right side of the window should populate with all the GradleRIO tasks.

Third party dependencies

If you intend to use any third-party software, you will need to add some JSON files to the vendordeps directory.  The best way to get these files is to get the official installers.  Examples of third party packages include:

Picking a JDK

By default, your IntelliJ project will use your JAVA_HOME environment variable to determine where Java is stored on your laptop.

However, it is possible to have multiple Java Development Kits (JDKs) installed on your laptop.  If you need pick a specific JDK (which IntelliJ will refer to as an SDK), you should select File > Project Structure > Project  from the main menu.  From the Project Structure dialog you can configure a new SDK or configure a previously defined SDK.

Set your team number

Open the build.gradle file and modify the team number setting, probably around 17:

intellij_program_gradle.png

First Build

Open the Gradle tools window.  You should see your new project listed.  Open your project’s icon and select the “build” folder and then double-click on the “build” task.  This should successfully build your new FRC Java project.

Step 3: Program to control one motor

If you started your program in RobotBuilder, you may already have mostly complete program.  If you started with the Quickstart example, your program is mostly just in one Robot.java file.  We can augment the Quickstart example to control a motor.

Back in the Project tools window, double-click on that Robot.java file.  This is your main Java program for controlling the robot.

All of the code in Robot.java is useful, but for simple programs it is optional.  To keep this tutorial really simple, we’re going to delete everything except robotInit() and teleopPeriodic().   Also we’re going to tweak the “import” statements a bit:

intellij_program_edit

For this example, assume we have a joystick connected to drivers’ station and a motor controller connect to the roboRIO.  We’ll create two variables around line 7 to represent them:

Joystick stick;
SpeedController motor;

Now we’ll instantiate the objects inside the robotInit() method:

public void robotInit() {
    stick = new Joystick(0);
    motor = new WPI_TalonSRX(2);
}

For my example, I’m using a Talon SRX connected to CAN ID 2.  If you’re using any other motor controller, just change the line to reflect your hardware.

Next, change your teleop mode so it reads the joystick, and sets the speed of the motor:

public void teleopPeriodic() {
    double speed=stick.getY();
    motor.set(speed);
}

The getY() function tells us how for forward or backwards the joystick has been pushed.  The speed value will be a number between -1.0 and 1.0.

From the Gradle tools window you can now build or deploy the program.


Step 4:  Drive your robot

Start up the FRC Driver Station software.  You should see green bars next to “Communications”, “Robot Code”, and “Joysticks”.  Also, you should see your correct team number.  If the team number is wrong, click the Gear icon on the left side to get to the setup panel.

vsc_program_driver

Click the “Enable” button to initialize teleoperated mode.  You should now be able to drive the motor with the joystick.

Consider for a moment what’s going on with the code.  The robotInit() method was called once, and then teleopPeriodic() is being called 50 times a second.  Each call of teleopPeriodic() reads the joystick and passes that value into the motor.

Further Reading:

Tutorial

Installing IntelliJ

IntelliJ is a sophisticated professional development environment for Java.  It is produced by the Jetbrains company, which also produces Android Studio, CLion for C++ development, and PyCharm for Python.  Although IntelliJ is a commercial product, there is Community Edition that is free to use.

FRC robot programs will be built using GradleRIO, which can execute from inside any development environment, including IntelliJ.

Step 0:  Install prerequisites

You must install Java.  Even if you will be developing in C++, you’ll need Java installed to run IntelliJ and GradleRIO.  You should define your JAVA_HOME environment variable to point to your JDK installation.  Often setting JAVA_HOME is considered optional, but I have seen many strange situations resolved after this variable has been properly set.

You should obtain and run the WPILib one-step installer (available at the beginning of the 2019 season).  Even if you’ll be developing with IntelliJ,  you’re likely to need the tools and project templates included in this package.

It is highly recommended (though not strictly required) that you also install git, instructions for which are at: https://git-scm.com/ .

Step 1: Download and install IntelliJ

IntelliJ is available for Windows, Macintosh, and Linux.  Download the installer from https://www.jetbrains.com/idea/download.  Select download on the “Community” version.

intelij_install_0

Run the installer, if possible as the Administrator.  After installation, you’ll probably have to reboot your machine.

intelij_install_1

The first time you start IntelliJ, it will go through setup dialogs.  You can safely take all the default options.

IntelliJ is a big, sophisticated program, but it’s pretty user friendly.  Text editors will appear in the center of the window.  The tabs on the edges of the windows open up “tool windows” on the sides.

intellij_install_windowTo get you started:

  1. The Project tool window lists all the files in your project.  Double-click on them to pop up an editor.
  2. The Structure tool window summarizes the contents of the file you are editing. Double-click on anything to navigate to that item.
  3. The Gradle tool window lists all the tasks that can be executed when building your project.  Double-click to execute.

Step 2: Build a simple project

Creating  complete robot programs in IntelliJ is a lesson I’ll defer to another tutorial.  For now, you can download an existing project and verify that IntelliJ can build robot programs.

  1. If you start with the startup dialog, Select “Check out from Version Control” .  If you are already in the IntelliJ window, select File > New > Project from Version Control > Git.   Give the URL value of: https://github.com/firebears-frc/testrobot0.git and then hit the Clone button.
  2. Open the “Project” tool window on the left of the screen.  Expand the testrobot0 project to see all the files.  Right-click on the build.gradle file to get a popup menu.  Select the “Import Gradle project” item, which will likely be the last item on the list.
  3. Importing will take another minute.  After this “Gradle” tool window will become available on the right side of the window.
  4. When importing is done, you should also see testrobot0 in your Gradle tool window.  Open this item and then open “build”.  Double-click on the “assemble” task.  This should successfully compile the program.
  5. Under embeddedtools, double-click on the “deploy” task to deploy the program to your robot.  This will fail if you aren’t connected to a roboRIO.  But, no harm will have been done.

Further Reading:

Tutorial

Debugging: Shuffleboard

Shuffleboard is a customizable dashboard that provides amazing visibility into your robot. You can set up many graphical widgets on the Shuffleboard window, each of which displays information from the robot.  For instance you can create widgets for current motor speeds, air pressure, or the output of sensors.  The Shufflebord window can have multiple tabs to organize the widgets.

You can use Shuffleboard to provide real-time information while driving in a competition, but it’s also very useful while developing and testing your hardware and software.  It can definitely help you out when you’re trying to answer questions like “Are the actuators and sensors working correctly?” or “Why doesn’t it behave the same as it did yesterday?” or generally “What’s really going on inside the robot?”

There are at least three ways to start up this tool.  Within the driver station software, you can specify Shuffleboard as your “Dashboard Type”, which will cause shuffleboard to start up when you start the driver station.  You can also start it from the Visual Studio Code Command Palette with the command “WPILib: Start Tool”.  A third way to start it up is to start the program directly from the “tools” directory in your FRC install. (e.g. C:\Users\Public\frc2019\tools).

The default configuration for Shuffleboard has two tabs listed at the top:  SmartDashboard and Livewindow.

The SmartDashboard Tab

First, a bit of history:  SmartDashboard is a dashboard similar to Shuffleboard, but it is older and has fewer features.  Shuffleboard expands on the programming interface for this older program.   Many of the programming examples that come with WPILib will contain code that sets up widgets on SmartDashboard.  In the same way, these calls will create widgets in Shuffleboard.

The SmartDashboard tab is the default destination for custom widgets created within your robot program.

debug_shuffleboard_smartdashboard

The widgets you can add to this tab fall into two categories:  raw data and Sendable objects.

Raw Data Widgets

You can display numeric, boolean, or text values directly to Shuffleboard.

SmartDashboard.putNumber("Rangefinder dist", rangeFinder.getRangeInches());
SmartDashboard.putBoolean("Shooter", shooter.readyToFire());
SmartDashboard.putBoolean("Target visible", visionSystem.onTarget());
SmartDashboard.putString("Intake status", intake.getStatus());

The four widgets created above will not update automatically. You must put out the values again when you want them to change. You can update them in a periodic function, such as by putting the rangefinder line into your robot’s robotPeriodic() method or a subsystem’s periodic() method.  Or, you can change them as needed.  For instance, you might use a periodic method up update the rangefinder distance every 20 milliseconds.  On the other hand your Intake subsystem might contain code that updates its dashboard status when the status actually changes.

Once the widgets show up on the Shuffleboard you can modify their format type.  For instance, a boolean widget can be text or a colored box.  A number widget can be just text or it could be a dial or graph.

The graph format can be especially when debugging. Imagine two graphs representing two drivetrain motors; you could compare the two graphs when considering if the motors are getting correct signals.

debug_shuffleboard_graphs.png

In general, raw data lets you answer basic debugging questions about the status of robot components.

Sendable Data Widgets

Many WPILib objects implement the “Sendable” interface, which allow those objects to communicate over the Shuffleboard’s network table interface.  Most motors, actuators, and sensors are sendable.

SmartDashboard.putData(leftMotor);
SmartDashboard.putData(rangeFinder1);
SmartDashboard.putData(rangeFinder2);
SmartDashboard.putData(grabberSolenoid);

The magic of sendable objects is that they update their data automatically.  You only need to call the above lines once, such as in your robot’s robotInit() method or in a subsystem’s constructor.

The visual format of each sendable widget is specific to its object.  For instance, the motor’s widget is a number slider that tells the current output of the motor.  For some debugging scenarios, you might be better off sending the motor output as raw data, so you can view it as a graph.

Note that you can optionally add a name value to the widget:

SmartDashboard.putData("Forward rangefinder", rangeFinder1);
SmartDashboard.putData("Backwards rangefinder", rangeFinder2);

More objects are sendable than you might expect. For instance all Commands are sendable and create a button widget that lets you trigger the command.  Subsystems are sendable and create a widget that tells you which Commands are currently running on them.

SmartDashboard.putData(Robot.driveTrain);
SmartDashboard.putData("Fire Shooter", new FireShooterCommand());
SmartDashboard.putData("Turn 90 Degrees", new TurnCommand(90));
SmartDashboard.putData(Scheduler.getInstance());

The LiveWindow Tab

LiveWindow shows each subsystem and the child components within them.  In teleop and autonomous modes the LiveWindow shows what the components are doing. However, if you enable Test mode on the driver station, this tab will come alive and allow you to manipulate the components.  This allows you to test (and debug) robot components without writing any special code.  Does your newly installed motor really work?  Enable test mode and you can run it at any speed.

debug_shuffleboard_livewindow

LiveWindow comes for free; no code changes are necessary to create it.  However, to get the best value out of this tool, you should let the dashboard know which components are children of which subsystems.

If you are creating your components within the subsystem code,  you can designate the child status with addChild() calls.  Note that the first argument to addChild is the text name for the component.  If you do not give a name, the LiveWindow will give you default names like “Spark[3]”.

public DriveTrain() {
    leftMotor = new Spark(0);
    addChild("Left", leftMotor);
    leftMotor.setInverted(false);
    rightMotor = new Spark(1);
    addChild("Right", rightMotor);
    rightMotor.setInverted(false);
    rangeFinder = new Ultrasonic(2, 3);
    addChild("rangeFinder", rangeFinder);
}

If you are creating your components elsewhere, such as in a RobotMap class, you can still designate the child-relationship by giving the component a name and subsystem name:

intakeMotor=new Spark(3);
intakeMotor.setName("Intake", "intakeMotor");

Another absolutely genius feature of LiveWindow is that it lets you configure PID subsystems in real time.  Configuring PID without this feature involves a lot of trial and error, mixed with constant recompile cycles.  With LiveWindow you can dial it in in real time, and then copy the chosen parameters back into your code.

Setting up a Custom Debug Tab

The primary users for Shuffleboard are the robot drivers.  At the beginning of a match, the drivers will fire up their driver station and they will want to see only the widgets that assist them.  Programmers are secondary users of Shuffleboard, so we shouldn’t clutter up the main Shuffleboard screen with our diagnostic widgets.  For this reason, we may shift our widgets off to secondary tabs, or we may configure them to go away when we aren’t debugging.

You can write code that sets up new tabs and positions widgets within them.

Consider that the widgets described above look like long-term decisions.  You set them up and assume that you will always need them.  When debugging, we often create temporary code just for the purpose of answering certain questions.  You could create temporary code for widgets, but they may pop up and get in the way of your permanent widgets.  It would be nice to have a designated spot to put the temporary stuff.

A neat way to address this need is to programmatically create a “Debug” tab where all your temporary widgets.  Custom tabs can be created in your code:

ShuffleboardTab debugTab = Shuffleboard.getTab("Debug");

Widgets can then be added to the tab with a name (e.g. “Vision Dist”) and a default value.  The “withWidget” method declares the widget’s format type.  Number widgets can be of type “Number Bar”, “Number Slider”, “Graph”, “Voltage View” or “Text View”. Boolean widgets can be of type “Boolean Box”, “Toggle Button”, “Toggle Switch”, or “Text View”.  String widgets can only be “Text View”.

 NetworkTableEntry visionDistWidget = debugTab
        .add("Vision Dist", 0.0)
        .withWidget("Graph")
        .getEntry();

Values can then be set into the widgets like this:

visionDistWidget.setNumber(vision.getTargetDistance());

Values can be set throughout your code:

debug_shuffleboard_custom_code.png

Note that in this example, we set up all our widgets in the Robot class.  A better pattern might be to create the debugTab variable in the Robot class, but then create the debug widgets inside the subsystems and commands.

The above code will generate widgets on a custom tab on the Shuffleboard window:

debug_shuffleboard_custom_tab

Further Reading:

Tutorial

Debugging: print statements and logging

Debugging is the process of figuring out why software isn’t doing what it should, and then fixing it so it behaves better.

Computer programmers always spend more time debugging code than they do writing it in first place. It is important to build up your skills in debugging code, whether the problem is in your own software or in code written by others.

Strangely, there isn’t a lot of literature available on this subject, and practically no formal education on debugging software. There should be more study and more formal methodologies. At least, all programmers should know the general techniques used by others and should learn the tools that are available.

Formalizing the questions

Sometimes debugging is easy. You see the problem immediately, or after a minute’s thought. However, if the problem has taken more than a couple minute’s consideration, you should start to specify the questions you need answers to. Often it helps to actually write these questions.  Really.  Write down the questions as if you you’re posing them to some third party.

Typical questions are:

  • Exactly how do I reproduce this problem? What is the negative scenario (where the problem occurs) and what is a positive scenario (where there is no problem)
  • Where was the program executing when things went wrong? How far into the program did we get? In what routine did the problem occur, and what was the path to get to that routine?  Did the Command I’m working on even execute?
  • What is the state of the data at the time of the problem? What does the data look like in positive scenarios? Why isn’t my Command ever finished?  What are the input and output values on my PID controller?

Debugging with print statements

The oldest and most common tool for debugging is to put temporary “print” statements into the code. You can print out variable values so you know the state of the data. Sometimes you just print little messages telling you where the program was executing, so you get a better idea of where the problem occurred.

A print statement in Java looks like this:

System.out.println("motor speed is " + motor.get());

When this statement executes, the text will print out on VS Code’s RioLog window and also on the Driver Station’s console window.  The printed text will also be available in the Driver Station’s Log File Viewer.  For basic debugging, the console may prove more useful than the Log File Viewer.

Print statements help answer questions like “Did a specific routine even execute” or “How did the motor speed vary during autonomous”.

Exceptions and Stack traces

When something goes seriously wrong in a Java program, the program may communicate this to other parts of the program by “throwing an exception”.  When an exception occurs, the program breaks out of the routine it is running and passes the exception to the routine that called it.  The exception is then propagated up the calling stack until one of the routines can handle it.  Handling the exception is called “catching” the exception.

When an exception is thrown, the program often prints out a “stack trace” to the console, which will show where the error occurred.  There is an example stack trace:

ERROR 1 Unhandled exception: java.lang.NullPointerException org.firebears.betaTestRobot2.subsystems.Board.setMotor2(Board.java:82) 
Error at org.firebears.betaTestRobot2.subsystems.Board.setMotor2(Board.java:82): 
Unhandled exception: java.lang.NullPointerException 
  at org.firebears.betaTestRobot2.subsystems.Board.setMotor2(Board.java:82) 
  at org.firebears.betaTestRobot2.commands.AutonomousCommand.execute(AutonomousCommand.java:29) 
  at edu.wpi.first.wpilibj.command.Command.run(Command.java:292) 
  at edu.wpi.first.wpilibj.command.Scheduler.run(Scheduler.java:224) 
  at org.firebears.betaTestRobot2.Robot.autonomousPeriodic(Robot.java:118) 
  at edu.wpi.first.wpilibj.IterativeRobotBase.loopFunc(IterativeRobotBase.java:225) 
  at edu.wpi.first.wpilibj.TimedRobot.startCompetition(TimedRobot.java:81) 
  at edu.wpi.first.wpilibj.RobotBase.startRobot(RobotBase.java:261) 
  at org.firebears.betaTestRobot2.Main.main(Main.java:20) 
Warning 1 Robots should not quit, but yours did! edu.wpi.first.wpilibj.RobotBase.startRobot(RobotBase.java:272) 
Warning at edu.wpi.first.wpilibj.RobotBase.startRobot(RobotBase.java:272): Robots should not quit, but yours did! 
ERROR 1 The startCompetition() method (or methods called by it) should have handled the exception above.

The above stack trace shows that an unexpected null value was encountered when the AutonomousCommand tried to set a motor value.

A stack trace is kind of a good news / bad news situation.  On one hand, you have a serious problem that shuts down processing.  On the other hand, you know generally what went wrong and exactly where it happened.

Learn to read stack traces and use them in your debugging.  Understand what the exception types are and how to interpret the calling stack.

Logging

The print statements described above are temporary changes to the program.  You should delete them after they have served their purpose.

Logging is a more formal process of printing out program state and execution.  If you identify things you want to monitor, you can leave the logging statements in your code, and then selectively turn on the ones you want to print.  Logs let you answer questions like “How often did our pneumatics fire?” or “What command was running just before we experienced a brownout?” or “Which autonomous program executed and what happened during that command?”

You can log items of different levels of importance.  Java supports seven levels of log severity, in this order:

  • SEVERE – serious failures
  • WARNING – potential problems
  • INFO – informational messages
  • CONFIG – configuration change messages
  • FINE – detailed debugging and tracing messages
  • FINER – more detailed debugging messages
  • FINEST – highly detailed debugging messages

Before you can do any logging, you must first create a Logger variable in each Java class:

private final Logger logger = Logger.getLogger(this.getClass().getName());

To actually create logs, call methods on the logger variable:

logger.fine("vision target acquired: angle=" + a + " : dist=" + d);

logger.config("PID controller values: " + p + "," + i+ "," + d);

logger.info("starting AutonomousCommand3 : gameData=" + gameData);

logger.warning("Air pressure is only " + pressure + " psi");

If you catch and handle an exception, you may want to log the problem, even if you’ve taken care of it.  The proper form is to add the exception to the log statement.  The following code will log a warning message, accompanied by the stack trace:

} catch (IOException e) {
    logger.log(Level.WARNING, "Failed to open connection", e);
}

Make good decisions about what to log. Don’t get carried way. Too many logs might create performance problems. Too many logs make it harder to find what you’re interested in.

Logged data will show up on the driver station Console and also within the Log Viewer.  For long term monitoring, the Log Viewer becomes extremely useful.   The Log Viewer can be used to reconstruct what happened during match.  Having some well chosen log statements may help you reconstruct what commands executed at what times, and what were the critical values of air pressure, elevator height, or motor speed.

Configuring your Loggers

Logging can be reconfigured to print out different things for different scenarios. For instance, you may decide that only messages of level INFO or higher get printed.  Later you can easily switch the level down to FINE, which will cause all the CONFIG and FINE messages to also print.  You can also specify different levels for different Java packages.  For instance, you may want the default log level to be CONFIG, but the autonomous commands log at the FINE level.  These levels are easy to set and easy to change later.

To configure your logging, create a file called “logging.properties” in your “deploy” directory:

debug_log_config.png

Here’s the content of our sample file:

frc.robot.handlers=java.util.logging.ConsoleHandler
java.util.logging.ConsoleHandler.level=ALL

frc.robot.level=CONFIG
frc.robot.commands.auto=FINE
frc.robot.subsystems.DriveTrain=FINEST

The first two lines just cause all messages in your project to be printed out to the console.  Line 4 sets the default logging level to CONFIG or higher for all loggers under the frc.robot package.  Line 5 causes all logging in the frc.robot.commands.auto package to log at the FINE level.  Line 6 sets the logging level of the DriveTrain subsystem to be FINEST.

To tell Java where your logging config file is, you must add one line to your build.gradle file.   You must add one jvmArg to the deploy / artifacts / frcJavaArtifact section:

frcJavaArtifact('frcJava') {
    targets << "roborio"
    jvmArgs = [ '-Djava.util.logging.config.file=/home/lvuser/deploy/logging.properties' ]
    // Debug can be overridden by command line, for use with VSCode
    debug = getDebugOrDefault(false)
}

Configuration specific behavior

Occasionally, you may need to do a little special processing that depends on the logging configuration.  Most of the time this is a bad idea, because logging should not change the behavior of your code.   On the rare occasions when this is necessary, you can detect the logging level as follows:

if (logger.isLoggable(Level.FINE)) {
    doubled=lidar.getDistance();
    logger.fine("Lidar distance = "+ d);
}

Further Reading:

Tutorial

Creating Java Programs with Eclipse

Creating GradleRIO FRC robot programs in Eclipse is quite easy.

Step 0: The prerequisites

At this point you should already have installed Java and set up Eclipse with the Buildship Gradle plugin.

You must be connected to the internet the first time you build the project.  After the first build, you can build in offline mode.

Also, you should obtain and run the WPILib one-step installer (available at the beginning of the 2019 season).  Even if you’ll be developing with Eclipse,  you’re likely to need the tools and project templates included in this package.

Step 1: Create a new Robot Project

There are currently several ways to create a basic WPILib robot project:

  • Create a new robot project with VS Code using the WPILib extension.
  • Create a project with RobotBuilder.  You will need a recent version of RobotBuilder that generates GradleRIO projects.  The 2019 software release will contain all new tools, including RobotBuilder.  Or, you can build the latest version from GitHub.
    RobotBuilder creates a full command-based project, so it may be more complicated than what is described in Step 3 below here.
  • Uncompress a copy of the  Quickstart.zip file and make a copy of the “java” directory.  Rename the directory to whatever you like.

Now, whichever method you use, add an empty directory called “vendordeps”.   Your project should now look like this (plus or minus the BSD license file):

eclipse_program_files.png

There’s one tiny change you must make to the build.gradle file before importing into Eclipse.  Open build.gradle in a text editor and set you team number at about line 17:

eclipse_program_gradle

Then, inside Eclipse, open the File menu and select File > Import > Gradle > Existing Gradle Project.  Select your project root directory and hit the “Finish” button.  It may take a while the first time you load a Gradle project, because Eclipse must download the dependencies off the internet.

Third party dependencies

If you intend to use any third-party software, you will need to add some JSON files to the vendordeps directory.  The best way to get these files is to get the official installers.  Examples of third party packages include:

First Build

Open the Gradle Tasks view.  You should see your new project listed. From the tasks view, open your project’s icon and select the “build” folder and then double-click on the “build” task.  This should successfully build your new FRC Java project.

Check the Problems view.  There should be no errors in your project.


Step 2: Make the project your own

Your minimal project is too generic, and you should now tweak it for you and your team.

In the Package Explorer, open the src/main/java folder.  Drill into the packages to reveal the Robot.java file.

If you started with the Quickstart.zip, the base package will be “frc.robot”. You can change it to almost anything, but a good choice would be to your team name or number.  Right-click on the package name and select Refactor > Rename…    Specify your new package name and hit OK.  Next, double-click on the build.gradle file, which will pop open an editor.  This file controls the build process.   If there is a ROBOT_CLASS variable, make sure it uses your new package name.  Hit Control-S to save.

Go back to the Gradle Tasks menu and execute build > build.  Everything should build successfully.  If your robot is connected, you can also deploy code by selecting the embeddedtools > deploy task.


Step 3: Program to control one motor

If you started your program in RobotBuilder, you may already have mostly complete program.  If you started with the Quickstart example, your program is mostly just in one Robot.java file.  We can augment the Quickstart example to control a motor.

Back in the Package Explorer, double-click on that Robot.java file.  This is your main Java program for controlling the robot.

All of the code in Robot.java is useful, but for simple programs it is optional.  To keep this tutorial really simple, we’re going to delete everything except robotInit() and teleopPeriodic().   Also we’re going to tweak the “import” statements a bit:

eclipse_program_1

For this example, assume we have a joystick connected to drivers’ station and a motor controller connect to the roboRIO.  We’ll create two variables around line 7 to represent them:

Joystick stick;
SpeedController motor;

Now we’ll instantiate the objects inside the robotInit() method:

public void robotInit() {
    stick = new Joystick(0);
    motor = new WPI_TalonSRX(2);
}

For my example, I’m using a Talon SRX connected to CAN ID 2.  If you’re using any other motor controller, just change the line to reflect your hardware.

Next, change your teleop mode so it reads the joystick, and sets the speed of the motor:

public void teleopPeriodic() {
    double speed=stick.getY();
    motor.set(speed);
}

The getY() function tells us how for forward or backwards the joystick has been pushed.  The speed value will be a number between -1.0 and 1.0.

At this point, check the Problems view and verify that there are no compiler errors.  From the Gradle Tasks view you can now build or deploy the program.


Step 4:  Drive your robot

Start up the FRC Driver Station software.  You should see green bars next to “Communications”, “Robot Code”, and “Joysticks”.  Also, you should see your correct team number.  If the team number is wrong, click the Gear icon on the left side to get to the setup panel.

vsc_program_driver

Click the “Enable” button to initialize teleoperated mode.  You should now be able to drive the motor with the joystick.

Consider for a moment what’s going on with the code.  The robotInit() method was called once, and then teleopPeriodic() is being called 50 times a second.  Each call of teleopPeriodic() reads the joystick and passes that value into the motor.

Further Reading:


Tutorial

Creating Java Robot Programs with VS Code

Now that you’ve got Visual Studio Code installed and configured for WPILib, you can start creating robot programs.  The WPILib extension contains a wizard to get you going quickly.

You can start coding before the robot exists, but if you have a physical robot available, so much the better.  For this example, let’s assume we have the roboRIO set up on a test board, with a joystick, one motor and one motor controller.

Step 1: Create a new Robot Project

Start up VS Code.  If the WPILib extension is properly loaded, then every window’s title bar will have a red hexagon around the letter “W”.  This is a button that will open up the Command Palette to show all the WPILib commands.

wpilib_logo

Click on the “W” button, and select “Create a new Project”.

vsc_program_palette

This will pop open the WPILib Project Creator window.

vsc_program_creator

There are three buttons just under the welcome message.

  • The first button lets you choose either Template or Example.  Templates are bare-minimum projects that can be the basis for your robot program. Examples are projects for specific purposes.  Examples can also be the basis for your work, but they are especially useful to demonstrate different robot functions.
  • The second button lets you choose either Java or C++ programs.
  • The third button picks a specific Template or Example.

For this example, we’ll specify a Java template for “Iterative Robot”.   Fill in a parent folder, project name, and your team number.  Generate the project and open it in the current window.

Once generated, VS Code will open the File Explorer sidebar, so you can see all the new files created.  Go ahead and look at everything. In particular note that all the Java source code is under the “src” directory.  Also, take a look at the “build.gradle” file which controls how the project is compiled and deployed.

This project is a complete robot program.  You could deploy it to your robot, although it doesn’t do anything yet.  Click on the “W” button and select “Build Robot Code”.  All code will be compiled locally, and you should see the message “BUILD SUCCESSFUL”.

Step 2: Program to control one motor

From the File Explorer, open up the “Robot.java” file.  This is the program executed by your robot.  Read through the whole file.

vsc_program_0

The robot will execute Robot.java as follows:

  • When the robot starts executing the program, it will initialize all class variables, and will then call robotInit().  Then, no matter what mode it is in, it will call robotPeriodic() repeatedly.  The standard for FRC robots is to attempt 50 calls a second.
  • When the robot transitions into autonomous mode, it will call autonomousInit() once and then call autonomousPeriodic() repeatedly.
  • When the robot transitions into teleoperated mode, it will call teleopoInit() once and then call teleopPeriodic() repeatedly.
  • There are also methods for testInit(), testPeriodic(),  disabledInit(), and disabledPeriodic().   These are not often used.

To keep this tutorial really simple, we’re going to delete everything except robotInit() and teleopPeriodic().  Your bare-minimum robot program is below.  Once you’ve modified it, hit the “W” button and try to “Build Robot Code”;  you should get a successful build.

vsc_program_1

For this example, assume we have a joystick connected to drivers’ station and a motor controller connect to the roboRIO.  We’ll create two variables around line 7 to represent them:

Joystick stick;
SpeedController motor;

Now we’ll instantiate the objects inside the robotInit() method:

public void robotInit() {
    stick = new Joystick(0);
    motor = new WPI_TalonSRX(2);
}

For my example, I’m using a Talon SRX connected to CAN ID 2.  If you’re using any other motor controller, just change the line to reflect your hardware.

Next, change your teleop mode so it reads the joystick, and sets the speed of the motor:

public void teleopPeriodic() {
    double speed=stick.getY();
    motor.set(speed);
}

The getY() function tells us how for forward or backwards the joystick has been pushed.  The speed value will be a number between -1.0 and 1.0.

Hit the “W” button and build robot code again.  You should get BUILD SUCCESSFUL.

Step 3: Build and deploy

Now, connect all the hardware.  Your laptop should connect to the roboRIO, either through USB, Ethernet, or through the radio.  The joystick should be attached to the laptop.

Hit the “W” button and choose “Deploy Robot Code”.  VS Code will compile the project again and deploy it out to the roboRIO.  You should see BUILD SUCCESSFUL in the terminal window.  The RioLog window will open inside VS Code.

vsc_program_deploy

The most common failure at this point is “Target roborio could not be found at any location”, which means that you’ve failed to make a network connection to the robot.  Debug all the physical connections or maybe try a different way of connecting to the robot.  Sometimes you will need to disconnect from all other networks, so VS Code isn’t trying to find your robot out on the open internet.

Step 4: Drive your robot

Start up the FRC Driver Station software.  You should see green bars next to “Communications”, “Robot Code”, and “Joysticks”.  Also, you should see your correct team number.  If the team number is wrong, click the Gear icon on the left side to get to the setup panel.

vsc_program_driver

Click the “Enable” button to initialize teleoperated mode.  You should now be able to drive the motor with the joystick.

Note that the RioLog window in VS Code is still connected and will show you console output from the roboRIO.

Consider for a moment what’s going on with the code.  The robotInit() method was called once, and then teleopPeriodic() is being called 50 times a second.  Each call of teleopPeriodic() reads the joystick and passes that value into the motor.

Further Reading:


Tutorial

Installing VS Code

Note that the following document was written while we were still in the 2019 alpha test of WPILib.  When the 2019 software is officially released, it will include a one-step installer that sets up almost everything into a single frc2019 directory, including a customized version of Visual Studio Code. So, some of the following may be unnecessary, but there is still some good information about VS Code.  Also, you could use the following to roll your own environment, or experiment with developmental versions of WPILib.

When the new software is officially released, it is recommended that you use the one-step installer.

Starting in 2019, the officially supported development environment for FRC software development will be Visual Studio Code. That’s not to say that you cannot use Eclipse, IntelliJ, or vim if you want. In fact, if your team is happy with another environment, then you can safely stick with it. However, the excellent support from the WPILib team will be behind Visual Studio Code.

The first thing to know is that Visual Studio Code is not the same as Visual Studio. Visual Studio is a heavyweight Integrated Development Environment, primary for working with Microsoft applications. Visual Studio Code (let’s call it VSCode) is a much lighter text editor with an extension mechanism. The WPILib team will be providing a new extension for FRC development.

FRC robot programs will be built using GradleRIO, which can also be executed from Eclipse, IntelliJ or from the command line.

Step 0: Install prerequisites

You must install Java.  Even if you will be developing in C++, you’ll need Java installed to run GradleRIO.  You must define your JAVA_HOME environment variable, since VSCode uses it to find your Java install.  After installing, you should be able to execute “java -version” at a command prompt and get back the current version of the java runtime.  Execute “javac -version” to get back the version of the java compiler.

You must install git, instructions for which are at: https://git-scm.com/ Even if you aren’t using git, VSCode expects it.  After installing, try executing “git –version” at a command prompt.  If it prints back the git version number, you’ve installed it correctly.

If you will be doing C++ development, you must install the compiler toolchains at: http://first.wpi.edu/FRC/roborio/toolchains/

Step 1 : Download and install VSCode

VSCode is available for Windows, Macintosh, and Linux. Download the installer from https://code.visualstudio.com/download . If possible, run the installer as Administrator.

Once installed, VSCode will start up at the Welcome screen

vsc_install_vsc

VSCode is pretty feature rich, and you should definitely start reading the documentation and memorizing the keyboard shortcuts.  Here are a few concepts to get started:

  1. The icons on the left edge make up the “Activity Bar”.  Clicking on the icons will open up the “Sidebar” which offers more functions.
    The icon on top opens the “Explorer” sidebar which shows all the files that you can edit.
    The squarish icon on bottom opens the “Extension” sidebar, which lets you manage software extensions for VSCode.
    Hitting control-B (or command-B on a Mac) will toggle away the sidebar, so you can make full use of screen space.
  2. Holding the control key down and hitting the back-quote character will open a terminal panel on the lower part of the screen.  (The back-quote character is usually in the upper left corner of your keyboard, just under the Esc key).   You’ll probably need to get comfortable with terminals and command lines when developing with VSCode.
    Hitting control-back-quote again will toggle the terminal away.
  3. The F1 key will open the “Command Palette” at the top of the screen.  Also, you can hit control-shift-P on Windows or Linux.  Macintosh users can hit Command-Shift-P.  The Command Palette lets you invoke special commands inside VSCode.  It’s pretty good about offering you suggestions for what you want to do.  Many of these functions are available from menus or from keyboard shortcuts, but you’ll find yourself using the Command Palette a lot.
    The FRC extension for WPILib adds new commands to the Command Palette for building robot code and reconfiguring your robot development environment.

Step 2 : Install language extensions

Click the square “Extension” icon on the Activity Bar.

If you will be doing Java development, type “Java Extension Pack” into the sidebar window.  Select the entry for “Java Extension Pack” and click the green Install button.  After the install is done, click the blue Reload button to restart VSCode.

vsc_install_java

If you will be doing C++ development, search for the “C/C++” extension.  Install and Reload.

vsc_install_three_dot

Note the three dots on the upper right corner of the sidebar.  VS Code calls this the “More Actions” button, and clicking on it will open a menu.  Select “Show Installed Extensions” from the menu.  If everything was successful, you should see your extensions listed in the sidebar.

Step 3 : Install the WPILib extension

At the time of this writing, you can get the alpha release of the WPILib extension from https://github.com/wpilibsuite/vscode-wpilib/releases .  Download the VSIX file.

Click the “Extension” icon on the Activity Bar to open up the Extension sidebar.  Click on the More Actions button on the upper right corner of the sidebar and select “Install from VSIX…”  Specify your new VSIX file.  Install and then hit the blue Reload button.

If you show installed extensions, you should now see the WPILib extension added.  The Command Palette will now offer WPILib commands.  There will also be a little “W” button in a red hexagon on the title bar of all windows. It pops open the Command Palette and lists all WPILib commands.

vsc_install_wpilib

Further Reading:

Tutorial

Installing Java for FRC programming

Note that the following document was written while we were still in the 2019 alpha test of WPILib.  When the 2019 software is officially released, it will include a one-step installer that sets up almost everything into a single frc2019 directory, including a copy of Java version 11.  This document is still good information, especially if you intend to use more than the standard VS Code environment.  If you intend to use VS Code, it is recommended that you:

  • Use the official installer.
  • Set your JAVA_HOME environment variable to the frc2019/jdk directory, as explained below.
  • Install git, as explained below.

If you intend to program your robot in Java, you will need to  install version 11 of the Java Development Kit onto your computer.

Actually, the first step might be to see if you already have Java installed.  Pull up a command window (the CMD program for windows or the terminal program on a Mac) and type the command

java -version


java_install_version1.png

If your terminal responds with a version of 11 or more, you might already be set.  Or, you might want to install the latest version, as described below.

Installing Java is really easy.  Let’s see how complicated I can make it.

Step 1: Downloading and Installing the JDK

You’ll want the JDK download for the latest version of Java SE 11 (which at the time of this writing was Java SE 11.0.1).

You can download Java at http://java.oracle.com.  This page changes occasionally, but you should click into the download section for “Java SE”.  From the “Java SE Downloads” page, look for the Java SE 11 section and click on the Oracle JDK download link.

Note that Java comes in two main distributions: the JRE and the JDK. The Java Runtime Environment (JRE) contains only the software to run Java programs.  The Java Development Kit extends the JRE to also let you compile new programs.  For our purposes, you always need the JDK.  Sometimes you’ll find a computer that has both the JRE and JDK installed.  This is perfectly OK, as long as your environment is configured to use the JDK installation.

java_install_download.png

From the JDK 1 Downloads page, accept the license agreement and then download the installer for your operating system.

Windows

There will be two choices for Windows installs, labeled “x86” and “x64”.  You almost certainly want the “x64” version, since the other version is for older 32-bit machines.

Download the installer and run it.  If possible, run the installer as the Administrator user.  After everything is done, you should see your new Java install under the C:/Program Files/Java directory.

Macintosh

Select the “osx” installer in the “dmg” format.  Download and run. Afterwards, you’ll see the installation under the /Library/Java/JavaVirtualMachines/ directory.

Linux

If you’re running Ubuntu or a similar Debian based linux, try executing:

sudo apt-get install openjdk-11-jre openjdk-11-jdk

For Ubuntu, the java installation will end up in /usr/lib/jvm/jdk-11.

For Fedora based Linux distributions, Oracle provides RPM packages.  You’ll probably want the “linux-x64.rpm” version, unless you have an old 32-bit machine.

Step 2: Setting your JAVA_HOME environment variable

Now that Java is installed, we must tell our software where to find it. We’ll want to put that directory path into a JAVA_HOME directory.

For all operating systems, the Java home directory will be the directory containing Java’s  “bin”, “jre”, and “lib” subdirectories.

Windows

Open up a File Explorer window and select the C drive.  Click into Program Files and then click into the Java directory.  Click into a directory named like your new JDK version.

Now click on the file path area and copy the text of the file path into the clipboard.  A typical Java home directory on Windows might be  C:\Program Files\Java\jdk-11 :


java_install_win_1

Next, open the Control Panel.  In the search box, type the words “environment variables”.  Click into the link for “Edit System Environment Variables”, which will pop up the System Properties dialog.  Click on “Environment Variables”.

Create a new System Environment Variable named JAVA_HOME, and paste in the value you just copied.

java_install_win_2.png

Next, click on the User Environment variable named “Path” and edit it.  Change it so the first thing in the Path variable is “%JAVA_HOME%\bin” .

Close out the variable and system dialogs.   Open up a CMD windows.  You should now be able to execute the “java -version” command and get back the current version number.

Macintosh

You’ll need to open a terminal window for this job.  Change directories to /Library/Java/JavaVirtualMachines/ .  In this directory you should see a directory whose name is similar to the Java version you just downloaded.  Change into that directory and then into the Contents/Home subdirectory.  That should be your new Java home directory.  For instance, if you installed jdk-11.0.1.jdk, then your Java home directory might be:  /Library/Java/JavaVirtualMachines/jdk-11.0.1.jdk/Contents/Home

java_install_mac_12.png

Change back to your user home directory and edit the file .bash_profile.   Create this file if it doesn’t already exist.  You’ll want to add the following two lines to the end of the file:

export JAVA__HOME=/Library/Java/JavaVirtualMachines/jdk-11.0.1.jdk/Contents/Home
export PATH=${JAVA_HOME}/bin:${PATH}

java_install_mac_2.png

Open a new Terminal window and test that you can execute “java -version” and get back a response.

Linux

Setting the environment variable in Linux is about the same as on a Mac, although you should add the variable definition to the .bashrc file, rather than the .bash_profile.  As above, run java -version to verify that the setup is correct.

Multiple versions of Java

You may have noticed that there are many versions of Java out there.

For the 2018 robot code, we must stick with version 8.  Newer versions will not work.  However, the WPILIB maintainers are committed to making all the new software work with version 11.   It’s perfectly OK to have multiple versions of Java installed on one computer.  Simply update the JAVA_HOME variable to point to your desired installation.

Visual Studio Code and GradleRIO will use the JAVA_HOME variable to find your desired Java installation.  If you develop using Eclipse, there may be an extra step in the Preferences dialog of defining your “installed JRE”.  You can then specify different JREs for different projects.  If you develop in IntelliJ, you can open the Project Structure to set a specific Software Development Kit for each project.

Note that there is also an open-source version of Java called OpenJDK.  This will work perfectly fine for FRC development.   In fact, the roboRIO executes Java programs using the Zulu JRE, which is derived from OpenJDK.  Right now, there’s not much downside to sticking with Oracle’s commercial JDK.

Install git

OK, this has nothing to do with Java. But, while you’re setting up your laptop, you might as well set up git.  Even if you don’t use git, you’ll need this later.

Git is the software version control system used by WPILib and many FRC teams.  For better or worse, git is the world’s most popular software configuration management system.  GitHub is a FIRST sponsor.  Individuals can get free GitHub accounts, and FIRST teams can get upgraded Team Accounts.

Instructions for installing git are at: https://git-scm.com . You might also take a look at:  https://www.atlassian.com/git/tutorials/install-git .  On Windows, do the installation as Administrator.

Further Reading