Tutorial

Unit Testing Commands

The WPILib command framework divides your robot program into two types of classes: subsystems and commands.  The subsystem classes represent the major physical parts of the robot, such as a shooter subsystem, a drive-train subsystem, or a manipulator arm subsystem.  The command classes define the actions taken by the subsystems, such as shooting a ball, moving the drive-train, or raising the manipulator arm.

unit_test_commands

Most of your programming time will go into creating, refining and debugging new commands.  Commands will be the most sophisticated part of your code.  Therefore they also have the greatest risk of going wrong.  Therefore you should spend a lot of time testing your commands.

So far we have tested simple functions and verified the primitive functionality in subsystems.  The next step is to created automated tests for your commands.

Testing a simple Command

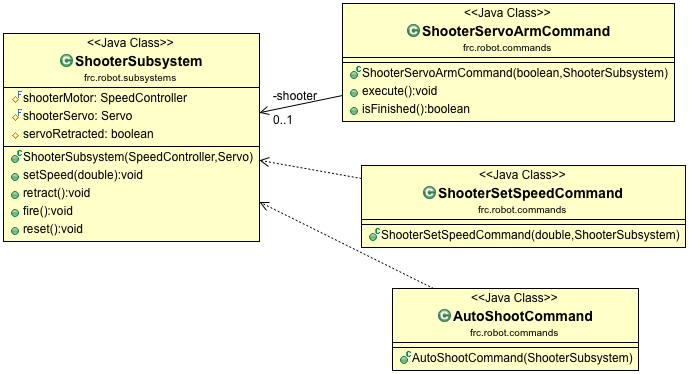
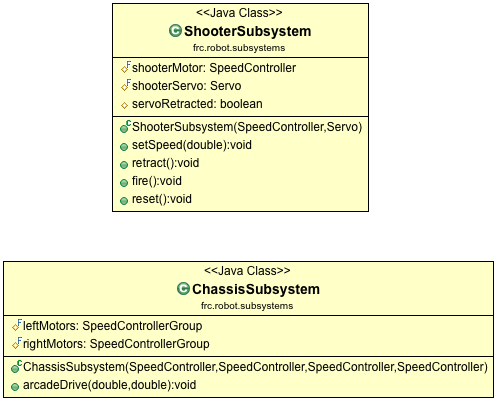
Our simple example robot contains a Shooter subsystem that shoots balls.  The ShooterSubsystem has a high-speed wheel for throwing the ball, and a servo arm that can raise the ball up until it touches the wheel.  We will need a command to set the wheel speed, and another to control the servo arm.

A simple Command

Here is the command to raise or lower the servo arm:

package frc.robot.commands;

import edu.wpi.first.wpilibj.experimental.command.*;
import frc.robot.subsystems.*;

public class ShooterServoArmCommand extends SendableCommandBase {

  private final boolean fire;
  private final ShooterSubsystem shooter;

  public ShooterServoArmCommand(boolean fireArm, ShooterSubsystem shooterSubsystem) {
    fire = fireArm;
    shooter = shooterSubsystem;
    addRequirements(shooter);
  }

  @Override
  public void execute() {
    if (fire) {
      shooter.fire();
    } else {
      shooter.retract();
    }
  }

  @Override
  public boolean isFinished() {
    return true;
  }
}

Take note of the two parameters on the constructor:  fireArm and shooterSubsystem.   This command can either raise the arm or lower it, depending on whether the fireArm parameter is true or false.

By specifying the shooterSubsytem in the constructor we are using Dependency Injection, which makes the code more reusable and more testable.  When testing, we can replace the real subsystems with mock objects that fake the subsystem’s functionality.

A simple Test

Our task does two different things: retract and fire. First let’s test that firing the ball works:

package frc.robot.commands;

import edu.wpi.first.wpilibj.experimental.command.*;
import frc.robot.subsystems.*;
import org.junit.*;

import static org.mockito.Mockito.mock;
import static org.mockito.Mockito.verify;

public class ShooterServoArmCommandTest {

    private CommandScheduler scheduler = null;

    @Before
    public void setup() {
        scheduler = CommandScheduler.getInstance();
    }

    @Test
    public void testFireArm() {
        // Arrange
        ShooterSubsystem shooter = mock(ShooterSubsystem.class);
        ShooterServoArmCommand fireCommand 
                = new ShooterServoArmCommand(true, shooter);

        // Act
        scheduler.schedule(fireCommand);
        scheduler.run();

        // Assert
        verify(shooter).fire();
    }
}

The test follows our Arrange / Act / Assert pattern:

  • We create a mock version of our ShooterSubsystem.  If we wanted, we could also define some mock behaviors at this point.
    We create the actual command we will test.  In this case we set the fireArm parameter to true, indicating that we want to fire the ball.
  • In the command framework, we never explicitly execute the command methods.  Instead, we “put it on the schedule”.   After this, the command scheduler will run the methods appropriately.  On a real robot, the scheduler tries to run all scheduled commands every 20 milliseconds.
    In this case we know that  our command will only run once before it’s done.
  • At the end of the test, we ask the mock framework to verify that the shooter’s “fire” command was called exactly once.

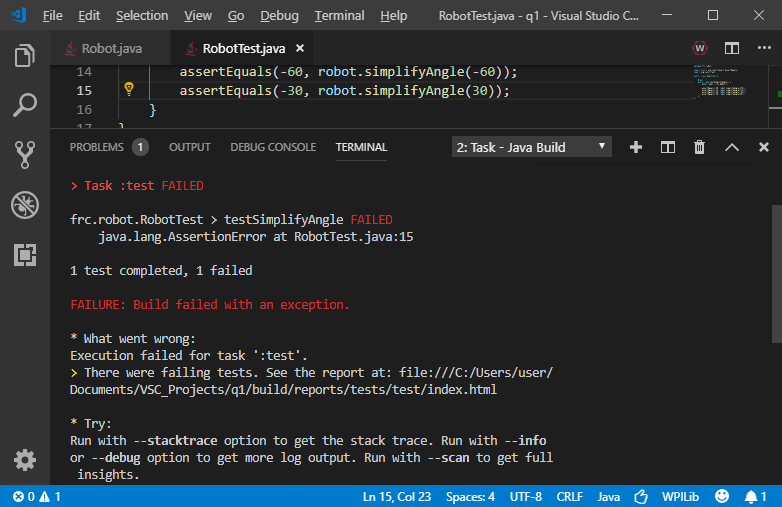
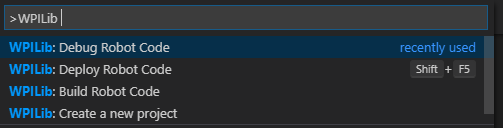
Unit tests will all execute whenever we build the code.  Go ahead and execute the “Build Robot Code” action within Visual Studio code.  Next write a similar test to verify that the command also correctly retracts the servo arm:

@Test
public void testRetractArm() {
    // Arrange
    ShooterSubsystem shooter = mock(ShooterSubsystem.class);
    ShooterServoArmCommand retractCommand = new ShooterServoArmCommand(false, shooter);

    // Act
    scheduler.schedule(retractCommand);
    scheduler.run();

    // Assert
    verify(shooter).retract();
}

Testing a Command Group

Simple commands can be grouped together to run sequentially or in parallel as more complicated commands.

A more complex Command

For instance, actually shooting a ball is a sequence of steps:

package frc.robot.commands;

import edu.wpi.first.wpilibj.experimental.command.*;
import frc.robot.subsystems.*;

public class AutoShootCommand extends SequentialCommandGroup {
    public AutoShootCommand(ShooterSubsystem shooter) {
        super(
                new PrintCommand("BEGIN: AutoShootCommand"),
                new ShooterServoArmCommand(false, shooter),
                new ShooterSetSpeedCommand(1.0, shooter),
                new WaitCommand(0.5),
                new ShooterServoArmCommand(true, shooter),
                new WaitCommand(0.5),
                new ShooterSetSpeedCommand(0.0, shooter),
                new ShooterServoArmCommand(false, shooter),
                new PrintCommand("END: AutoShootCommand")
        );
    }
}

Note that we are again using dependency injection, but that the same ShooterSubsystem will be used in all the internal commands.

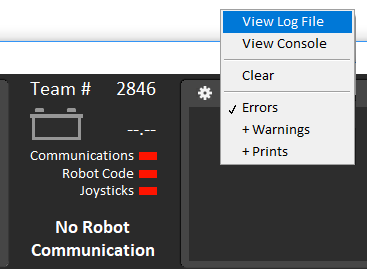
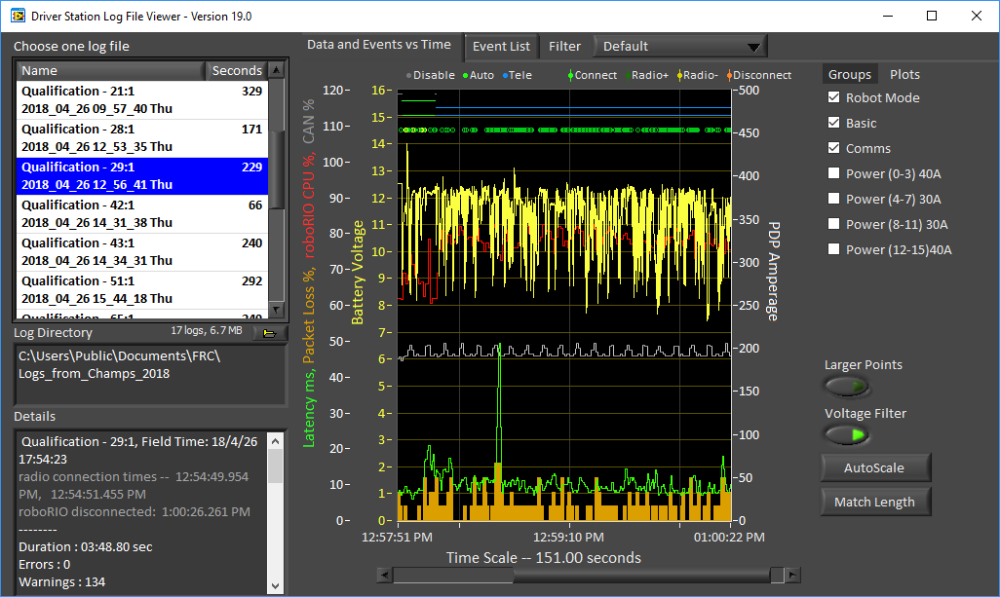
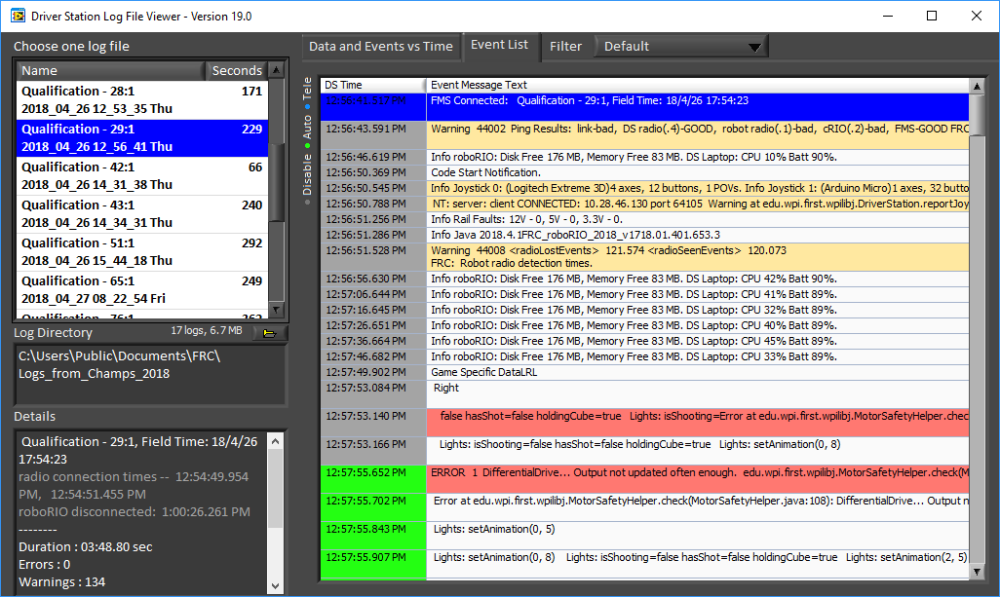
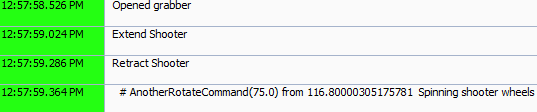
Besides the shooter commands, we’ve also thrown in a couple of PrintCommands.  These commands print out to the console at the beginning and end of the command.  They also print to the Log File Viewer to be reviewed after a match.

Also we’ve thrown in a couple of WaitCommands, which give the shooter wheel half a second to spin up before shooting and then maintain speed while the ball is firing.

Testing a Command Group

A command group test follows the same pattern as simpler tests:

package frc.robot.commands;

import static org.junit.Assert.*;
import static org.mockito.Mockito.*;

import org.junit.*;

import edu.wpi.first.wpilibj.experimental.command.CommandScheduler;
import frc.robot.subsystems.ShooterSubsystem;

public class AutoShootCommandTest {

    private CommandScheduler scheduler = null;

    @Before
    public void setup() {
        scheduler = CommandScheduler.getInstance();
    }

    @Test
    public void testShoot() throws InterruptedException {
        // Arrange
        ShooterSubsystem shooter = mock(ShooterSubsystem.class);
        AutoShootCommand command = new AutoShootCommand(shooter);

        // Act
        scheduler.schedule(command);
        for (int i=0; i<100; i++) {
            scheduler.run();
            Thread.sleep(20);
        }

        // Assert
        verify(shooter, times(2)).retract();
        verify(shooter, times(1)).fire();
        verify(shooter).setSpeed(1.0);
        verify(shooter).setSpeed(0.0);
    }
}

This command takes many run cycles, so run it many times, pausing 20 milliseconds between each execution.

After executing everything in the command group, we verify that the subsystem experienced all the actions for shooting.

Writing quality tests

It’s important to remember why we do unit testing.: we create suites of automated tests to improve the quality of our software.  Writing quality tests is a big subject and these last three articles have covered a lot of ground.  It would be easy to be overwhelmed, or in fact dubious, with all of this.  So keep your eye on the end goal:  software quality.

In a sense, writing methodical tests is a stepping stone from just programming into Software Engineering. Engineering means using systematic and disciplined practices when creating things.  Your tests will verify and quantify your software quality, in way that others can read and evaluate.

Further Reading

Tutorial

Unit Testing Subsystems

Testing is an element of any software development, and certainly it’s a big part of robot programming.  You’ve probably already done a lot of robot testing; deploy your code and test the robot.  Hopefully you’re already familiar with the idea of unit testing of small functions, but we can also automate the testing of whole subsystems.

Unit testing with WPILib

To demonstrate automated testing of robot subsystems, we’ll use a simplified robot program.  This program runs on a real robot build for the 2016 game, FIRST Stronghold.

A simple subsystem

In the WPILib command pattern a subsystem class represents a physical subset of the robot.  A subsystem contains physical components, such as motors and sensors.  There will be actions to perform on the subsystem, such as to drive or shoot.  For this example, we have a simple robot with two subsystems representing the robot chassis with its drive motors, and a shooter for throwing balls.

unit_test_subsystems.png

Mostly we’re going to work on testing the ShooterSubsystem.  The shooter has two components: a motor attached to a spinner wheel  and an arm attached to a servo that manipulates the ball.  To shoot a ball we will:

  1. Retract the servo arm so we can pick up a ball.
  2. Start the shooter wheel spinning.
  3. Extend the servo arm so the ball is pushed into the wheel.  The ball will go flying.
  4. Reset the system.  The wheel will be stopped and the servo retracted.

(Shooter Picture)

Here’s the code for the shooter subsystem:

package frc.robot.subsystems;

import static frc.robot.Constants.*;
import edu.wpi.first.wpilibj.Servo;
import edu.wpi.first.wpilibj.SpeedController;
import edu.wpi.first.wpilibj.experimental.command.*;

public class ShooterSubsystem extends SendableSubsystemBase {

    protected final SpeedController shooterMotor;
    protected final Servo shooterServo;
    protected boolean servoRetracted = true;

    public ShooterSubsystem(SpeedController motor, Servo servo) {
        shooterMotor = motor;
        shooterServo = servo;
    }

    public void setSpeed(double speed) {
        shooterMotor.set(speed);
    }

    public void retract() {
        shooterServo.set(SHOOTER_SERVO_MIN);
        servoRetracted = true;
    }

    public void fire() {
        shooterServo.set(SHOOTER_SERVO_MAX);
        servoRetracted = false;
    }

    public void reset() {
        setSpeed(0.0);
        retract();
    }
}

Note that the constructor takes two parameters as inputs: motor and servo. The motor and servo objects will be created elsewhere and then injected when the subsystem is constructed.

Mock testing with WPILib

The best way to do testing is with the full robot; load your code and go through a methodical test process.  Too often however, we don’t have sufficient access to the robot.  Maybe it hasn’t been built at all, or maybe it is shared with our teammates.  How can we test the code without access to the robot?  The answer is that we can test much of the logic with “mock” components.  Mocks are software objects that stand in for the real classes.  Instead of real motors, servos, and sensors, we’ll use mock motors, mock servos, and mock sensors.

We will use the Mockito framework to create mock SpeedControllers and mock Servos.   Mockito is a professional package for creating Java mocks, defining the mock behavior and checking the results.

To use Mockito, you’ll need to make two simple changes to your build.gradle file.

    1. Change the value of the includeDesktopSupport variable to true.
    2. Add the following line into the dependencies section: testCompile"org.mockito:mockito-core:2.+" .

unit_test_mockito

A simple unit test

Add a “test” directory under “src” for your java unit tests.  Right-click on “src”, select “New Folder” and enter “test/java/frc/robot/subsystems”.  Right-click on “subsystems” and select “create an empty class” named “ShooterSubsystemTest.java”

unit_test_test2.png

Now we can create a test of the subsystem’s constructor:

package frc.robot.subsystems;

import static org.junit.Assert.*;
import static org.mockito.Mockito.*;
import edu.wpi.first.wpilibj.*;
import org.junit.*;

public class ShooterSubsystemTest {

    @Test
    public void testConstructor() {
       // Arrange
        SpeedController motor = mock(SpeedController.class);
        Servo servo = mock(Servo.class);

        // Act
        ShooterSubsystem shooter = new ShooterSubsystem(motor, servo);

        // Assert
        assertEquals(true, shooter.servoRetracted);

    }
}

In this test we first create mock objects for the motor and the servo.  The action we are testing is just to create the shooter object.  After performing the action, we verify that the servo is retracted.

Note that the test is broken into sections.  The Arrange / Act / Assert breakdown is a common pattern for designing tests.  Sometimes we’ll add some extra sections, but most tests will have the basic three parts.

You could argue that this test is a little superficial, and you’d be right. However, this test does serve a purpose. If at some later date someone changed the subsystem so it didn’t initially retract the server, then this test would fail.   We would then need to decide whether the code or the test has become incorrect.

Another unit test

Next let’s write a test for the setSpeed method.  This method sets the speed of the motor.  After it has been executed, the motor controller will have a different speed:

@Test
public void testSetSpeed() {
    // Arrange
    SpeedController motor = mock(SpeedController.class);
    Servo servo = mock(Servo.class);
    ShooterSubsystem shooter = new ShooterSubsystem(motor, servo);

    when(motor.get()).thenReturn(0.5);

    // Act
    shooter.setSpeed(0.5);

    // Assert
    assertEquals(0.5, shooter.shooterMotor.get(), 0.001);
}

First we set up the mock objects and the shooter subsystem. This time we tweak the mock motor a little, specifying that when we get the motor’s speed, then it will return 0.5. The action is to set the speed. Afterwards we check that the speed was really set (and specifying a margin of error of 0.001).

As your tests get more sophisticated, you’ll use the “when” method to add more mock behavior to your mock objects.

The code above is another fairly superficial test, but it does exercise the code and the mock objects.  Let’s consider more features of the mock framework:

Yet another unit test

Let’s test the “reset” method of our subsystem.  In this case we want to verify that the motor has really been stopped and the servo arm has been retracted.

@Test
public void testReset() {
    // Arrange
    SpeedController motor = mock(SpeedController.class);
    Servo servo = mock(Servo.class);
    ShooterSubsystem shooter = new ShooterSubsystem(motor, servo);

    // Act
    shooter.reset();

    // Assert
    assertEquals(true, shooter.servoRetracted);
    verify(motor).set(0.0);
    verify(servo).set(SHOOTER_SERVO_MIN);
}

This time there are more lines of code in the “Assert” section.  Besides verifying that the server arm was retracted, we also run two verifications on the mock objects.

The “when” and “verify” features of mock objects are allow some sophisticated tests.  You may see your tests growing with many fiddly mock behaviors.  This is usually OK.  Just make your tests as simple as possible, but no simpler.

Dependency injection

Our ShooterSubsystem depends on two objects created elsewhere, a servo and a motor speed controller.  Those dependent objects are specified in our subsystems constructor.   This pattern is called Dependency Injection.  The tests described above wouldn’t be possible if we weren’t able to inject mock objects into our system-under-test.

Dependency Injection is an important concept within software engineering.  Besides encouraging testability, it supports the concept of Separation of Concerns. This means that we often break a large program into sections that each handle different concerns.  In this case we have one class that handles creation and definition of physical components (typically a RobotMap or RobotTemplate class) and another class that defines the behavior and interaction between those components (our subsystem).

Further Reading

Tutorial

Simple Unit Tests

Every programmer has at one time deployed code without having tested it.  Simple changes go out with the assumption that they can not possibly fail. And then they betray us.  We learn the lesson:  all code must be tested, thoroughly and repeatedly.

On robots we often need the hardware to do some of the testing, but there are still a lot of tests that can be executed offline.  Ideally, you should build up suites of tests that execute automatically; just start one test program and all tests execute.  There are many categories of automated tests, but the most common is called unit testing, because they test small units of functionality, including the functions you assumed can’t fail.

Well crafted unit tests will improve the quality of your software and insure its quality down the road.  You may choose to organize your development around those tests, a practice called Test Driven Development.  Unit tests are also essential to refactoring, which is a systematic technique for improving your code;  you’ll need automated test to verify that your refactored code still works correctly.

Unit testing with WPILib

GradleRIO is already set up for the unit testing frameworks JUnit and GoogleTest.   If you define unit test classes in your project, they will automatically execute every time you build the code.

Let’s define a simple function and create unit tests for it.  Don’t worry that this code looks too simple to merit testing.   Remember that no code is so trivial that it won’t fail.

A simple function

Suppose you’ve got a Gyro installed on your robot.  When you first start it up, the gyro will show 0 degrees.  Rotate the robot a little to the right and it might read 30 degrees.  However, the gyro’s scale is continuous, so after a lot of driving around it might read 1537 degrees or -2781 degrees.  This might mess up the math in some of your autonomous commands, since 1537 degrees is really the same as 97 degrees.  We need a function that simplifies angles into the range -180 to 180.  Here are some test cases:

  • 270 degree is the same as -90 degrees
  • -315 degrees is the same as 45 degrees
  • 30 degrees is still 30 degrees
  • -60 degrees is still -60 degrees

Here’s a simple conversion function.  It definitely isn’t perfect, but we’ll fix that in a minute:

public int simplifyAngle(int angle) {
    if (angle > 180) {
        angle = angle - 360;
    }
    if (angle < -180) {
        angle = angle + 360;
    }
    return angle;
}

For this example, this function is in your Robot class which is stored with the other java main classes in your “src” directory:

unit_test_func1

A simple unit test

Add a “test” directory under “src” for your java unit tests.  Right-click on “src”, select “New Folder” and enter “test/java/frc/robot”.  Right-click on “robot” and select create an empty class named “RobotTest.java”

unit_test_test1.png

Consider the test method:

@Test
public void testSimplifyAngle() {
    Robot robot = newRobot();
    assertEquals(-90, robot.simplifyAngle(270));
    assertEquals(-45, robot.simplifyAngle(315));
    assertEquals(-60, robot.simplifyAngle(-60));
    assertEquals(30, robot.simplifyAngle(30));
}

The @Test annotation on top means that this method will be executed by the GradleRIO test task.  We create a Robot object and then test our method for each of the test cases.

This test class will execute every time you build robot code.  If any of the assertions fail, the whole build will be rejected. To see what happens on a failure, temporarily change the 30 degree test so it expects -30 degrees. The build will fail and tell you to check line 15:

unit_test_fail1

Improving the function

How many test cases should you use?  Usually more than you would expect, even for simple functions.

Always include a trivial test case, sometimes called the “happy path” case. The 30 degree and -60 degree test might be considered happy path tests, but we could also test 0 degrees.  Add some test scenarios where there are logical transitions; these are called “corner cases”.  For this example, corner tests might be at 180 degrees and -180 degrees.  Also test a couple extreme cases, such as 1537 degrees and -2781 degrees.  Extreme tests at absolute maximums or minimums are called “edge cases”.

Now our test looks like this:

@Test
public void testSimplifyAngle() {
    Robot robot=new Robot();
    assertEquals(-90, robot.simplifyAngle(270));
    assertEquals(-45, robot.simplifyAngle(315));
    assertEquals(-60, robot.simplifyAngle(-60));
    assertEquals(30, robot.simplifyAngle(30));
    assertEquals(0, robot.simplifyAngle(0));
    assertEquals(180, robot.simplifyAngle(180));
    assertEquals(-180, robot.simplifyAngle(-180));
    assertEquals(97, robot.simplifyAngle(1537));
    assertEquals(99, robot.simplifyAngle(-2781));
}

Executing this test reveals that our function fails for the extreme cases.  Our function can’t handle 1537 degrees.  We’ve found a bug in our logic.   We go back to the original function and, after a little thought,  change it to the following:

public int simplifyAngle(int angle) {
    while (angle > 180) {
        angle = angle - 360;
    }
    while (angle < -180) {
        angle = angle + 360;
    }
    return angle;
}
Now our test passes.  The bug is fixed.

Refactoring

At some point, you or one of your teammates will rewrite parts of the robot code, at which point you must retest and verify that the new code is at least as good as the old.  For instance, someone might refactor the angle simplification like this:

public int simplifyAngle(int angle) {
    return angle > 180 
    ? simplifyAngle(angle - 360) 
    : angle < -180 ? simplifyAngle(angle + 360) : angle;
}

Does this function do the same job?  It turns out that it does. Is this function better? Well, it is shorter, but you should decide if it’s really more readable.

Eventually, you might stumble on logic like this:

public int simplifyAngle(int angle) {
    return  (int)Math.round(Math.IEEEremainder(angle,360.0));
}

This is even shorter.  It’s much more cryptic, but it does pass the tests.  You could use any of these functions in your robot.  Unit tests have verified that they all do the same thing.

Writing good tests

Now that you know how to create unit tests, start adding them to your robot projects. You will find that writing good tests is as difficult and subtle a skill as programming the robot code.  You should start watching for opportunities to test.  Break up your big methods into smaller methods and structure them so they are more amenable to testing.  Test the simple things, but especially watch for code that is tricky.

It’s probably possible to write too many tests, but don’t worry about that.  On professional projects the test suites are often larger than the baseline code.

Good unit tests should have the following qualities:

  1. Test the requirements and nothing but requirements.  In the above example we require that 270 degrees is simplified down to -90 degrees.  However, don’t try to craft tests that verify the number of times the “while” loop executes to achieve this.
  2. Tests should be deterministic and always succeed or fail based on the requirements.  Take care around code that depends on hardware or file systems or random functions or timers or large memory usage.  Structure your code so you can manage any randomness.
  3. Unit tests should be fast.  They execute before every build and you don’t want to start regretting how slow they are.
  4. Tests should be easy to read, understand, and maintain later

The above example is intentionally simple.  Once you’ve mastered the concepts you can start to think about automated testing of larger classes, non-trivial state machines,  subsystems and commands.

Further Reading

Tutorial

The Driver Station Log File Viewer

Every FRC team is familiar with the FRC Driver Station software.  It’s the tool we use to drive our robots, whether in competition or back at the shop.   Any serious driver will have tested every tab and button on this program.  Hopefully, they’ve also read the documentation.

When you installed the driver station, you also got the Driver Station Log Viewer.  The driver station records a lot of information about every driving session, whether in competition or in practice.   I know that some teams make use of the log viewer, but many never touch it, or only open it up when they’re in trouble.   Learning to use it will definitely upgrade your control systems diagnostic skills.

Introducing the log viewer

You can find the log viewer program installed in c:\PROGRA~2\FRCDRI~1, but the easy way to start it is directly from the driver station.   Click on the gear icon and select “View Log File”.

log_viewer_menu

The log viewer will pop up.

In the upper left part of the screen you’ll see a list of all matches and test runs that this driver’s laptop has witnessed, along with the log’s time in seconds.  If you were connected to a competition’s Field Management System, it will display the match name and number.  The driver station starts logging data as soon as it connects, which may be several minutes before your match starts.  FRC matches are always 150 seconds, but most log files contain the pre-match time as well.  If the time is less than 150 seconds, there was probably an error that truncated the log.

Below the log file list is the log directory.  You may switch to another directory if you have a collection of log files from another drive’s laptop.

log_viewer_window

In the middle of the window you will see the graph of your robot’s critical parameters. Get familiar with the different parameters, their different scales on the left, and the time scale along the bottom.

By dragging a selection on the graph you will zoom in to take a closer look at the data.  Once you’ve started zooming you can use the scroll bar at the bottom to move forwards and backwards in time.  Note the blue and green lines at the top of the graph;  if you zoom in enough they will become individual dots, spaced out at 50 readings per second.  Robot communication runs at 50 cycles per second, so each dot represents one reading.  Note that occasionally a dot will be missing, indicating a lost network packet.  You can zoom back out to the full graph by hitting the “AutoScale” button.

Hitting the “Match Length” button will zoom the graph to exactly 150 seconds.  Then use the scroll bar to position the upper green line on the left edge of the display.

The checkboxes on the upper left let you toggle different parameters.  You can turn off some lines to get a better look at others.  Or, you can turn on fine grained data, such as the electrical current on each PDP channel.  There are two tabs organizing the selectors, either by major groups or by individual plots.

log_viewer_selectors

Move your cursor over the graph while watching the Details box in the lower left corner of the window. Message details will give you additional insight into the graph parameters.

A basic log review procedure

Start reading your logs regularly, and you’ll get a sense of what good and bad logs look like for your robot.

Sometimes, you will need to look at the logs of a stranger’s robot.   During a competition, it’s pretty common for the FTA to call up one of the CSAs and say “Something weird happened to that team’s robot.  Go check their logs”.   The following is a basic procedure for evaluating a robot log:

  1. In the upper left corner, select the log file corresponding to match in question.  It’s easy to get the wrong match, so pay attention to the time stamps.   Glance at the graph and then click on a match or two prior to this one for comparison:
    1. Watch for notable differences in the yellow voltage line on the different graphs.  If the voltage in one match dips much lower, it may indicate a bad battery.
    2. Watch the green network latency line or the orange packet loss lines.  If network communication is bad in just one match there may be a problem with another robot, or some radio interference occurred during that match.   If network communication is always bad, your radio might be poorly positioned or might be malfunctioning.   Radios should be mounted horizontally and not be surrounded by metal.
    3. Reselect the match in question.  Look for any gaps in the graph that would indicate that something failed.  A roboRIO reboot creates a gap of about 10 to 15 seconds.  At the time of this writing, a radio reboot creates a gap of between 35 and 45 seconds. (Future radios will behave differently.)  A loose network cable will produce a gap of random length.
  2. Select the “Match Length” button and scroll until the green lines at the top are at the left edge.  Now you are seeing the full match on screen.
  3. The blue and green lines at the top of the graph are the “Robot Mode” indicators.
    log_viewer_graph_mode

    1. The green lines on top are the autonomous period and blue lines are the teleoperated period.  You may notice a tiny gray line between green and blue indicating that your robot was in disabled mode for an instant.
    2. The blue and green lines on top were transmitted from the robot, and they indicate what your robot thought the operating mode was.  Below these lines are the DS mode lines, indicating the operating mode of the driver station.
      The robot mode lines should match the DS mode lines and there should be no gaps.
  4. Below the mode lines is a row of dots which are event markers in the Event List.  If you trace your cursor across the dots the text messages will appear in the Details window.
    1. The green, yellow and red markers are log messages generated by the underlying WPILib framework.  Also, anything your robot code prints will appear as a marker dot.
    2. You might see brown markers, indicating a brownout event, indicating that the robot voltage fell below 6.8 volts.
    3. You might see purple watchdog markers, indicating that a MotorSafety object has gone too long without a signal, and has therefore been disabled temporarily.
  5. The big yellow graph is the battery voltage as recorded at the PDP.  Voltage should vary in the range between 12.5 and 8 volts.   Take note of the voltage before the match; a starting voltage below 12 indicates that an uncharged battery was installed.
    If there are times in the match were the robot stops for a moment, the graph will go flat.   If the voltage goes too low, the robot may experience a brownout.  Different batteries may go lower or may lose voltage quicker.
    log_viewer_graph_voltage.png
  6. The red line shows the roboRIO CPU utilization.  I have never seen a problem with this graph, but a spike here might indicate that excessive processing is taking place, and might cause a watchdog error.
    log_viewer_graph_cpu
    Interestingly, autonomous code usually requires less CPU than teleoperated code.
  7. A gray line shows the traffic load on the CAN bus.  I have never seen a problem with this and it’s always a uniformly jaggy line.
    log_viewer_graph_can.png
  8. The green and yellow lines at the bottom of the graph are the “Comms” group of statistics.   They show the health of your network communication.  Spikes in these graphs are common, so don’t worry unless you see bad network traffic for more than a couple seconds.
    log_viewer_graph_coms.png

    1. The green line shows network latency measured in milliseconds.  Hover your cursor over the lines to see the exact values.
      Typical trip times will be in the range of 5 to 20 ms.  Spikes of up to 60 ms are common.
    2. The orange line shows network packet loss in average packets lost per second.
      Losing 3 to 5 packets per second is pretty common.
  9. You can also view graphs of the current from the PDP.  You can enable groups of channels (such as channels 0 through 3), or individual PDP channel plots.  You may need to trace PDP channels back to specific motors to understand the output.
    Spikes in current may indicate motor stalls.  Watch for conditions where circuit breakers tripped.  Try comparing similar motors, such as the drive train motors, to see if any channel looks significantly different.
  10. At the top of the window is a tab labeled “Event List”.  Selecting it switches the display to show the text logs generated during your match.  Each line in this display corresponds to one of the “event marker” dots we discussed earlier.
    log_viewer_event_list
    There’s a lot of color coding in this display.  The timestamps on the left are colored gray or green or blue denoting the disabled / autonomous / teleop modes.  Any line containing the word “warning” will be colored orange and any line containing “error” will be red.

    1. If you had seen a problem in the data graph display, you can look at the events list for the same time period, to get clues about what happened.
    2. The list will contain messages from roboRIO.  There are informational logs about memory and disk capacity.  Pay especial attention to orange warning messages about “Ping Results”;  they tell you robot components were working, helping you diagnose network communication problems.   If your robot ever throws an Exception, it will be displayed as a red error message.
      log_viewer_ping
    3. Your robot software can also generate event logs.  Anything that your code prints to standard output will appear in the events logs.  You may choose to print out messages about what the robot is doing.  Print out when the robot does important things or when any commands are executed.  Print out your air pressure or some specific states your robot goes into.  This can be useful in general, but especially valuable when diagnosing an error condition.
      log_viewer_output
      In 2018’s game, the FMS transmitted random game data at the beginning of each match, which many teams used to pick different autonomous routines.  Printing out the game data and the autonomous choices was useful for post-match analysis.

Specific problems to investigate

Brownouts

One of the most important problems you can find in the logs are brownout conditions, where the voltage falls too low. When the voltage starts falling below 6.8 volts, the roboRIO will protect its own existence by disabling motor outputs.

  1. The most common cause of brownouts is bad batteries or uncharged batteries.  Note if brownouts correlate to certain batteries.
  2. Brownouts may also be caused by shorts and loose connections.  In particular, look for loose wires on the battery connections, the main breaker connections, and all the PDP connections.
    These brownouts may happen in every match.  They may correlate to violent actions.   Pull test all connections and otherwise check over the wiring.
  3. Binding in the system may cause brownouts.   Reduce the friction on everything.
  4. Too many motors can consume too much current.  See if brownouts correlate to actions that use many motors.  Consider increasing the ramp rate of your motor controllers.  Ramp rate is measured in the time it takes to go from no power to maximum power.

About motor safety / watchdog errors

One message you may see in the event logs or on the console is “Output not updated often enough”, which indicates that one of your motors is not getting signals often enough.  Drive motor controllers are MotorSafety objects, and they will shut the motors down if they aren’t constantly fed signals.  This message usually means that some other part of your software is taking too much time.

Further Reading:

Tutorial

Debugging: Java Remote debugging

So far you’ve probably been debugging Java code by adding print statements;  you add code that gives you a peek into the robot’s internal state.  Monitoring the robot with ShuffleBoard is similar;  you add output statements to your code.

Imagine a better system that doesn’t require added code, where you could stop time, crack the roboRIO open and see what was going on inside.   You could examine the variables and then watch the lines of code execute, one at at time.  This technique, called Remote Debugging, is available to you from most modern Java development environments.

Remote debugging lets us answer questions like “Did my code even get executed?” or  “Did the initialization code really get executed before the periodic code?” or “What were the variable values?”.   Since the the debugger can let you see the actual execution, you can also verify that conditionals and loops really execute the way you expect.  You can even use the debugger to alter variable values, so novel scenarios can be tested.

We call this technique “remote” debugging because it involves a network connection between your programming laptop and the roboRIO.  Your robot program is executing on the RIO, but it will be controlled and monitored by the development environment on your laptop.  You’ll be watching the action as if it’s happening on your screen, but the action is actually occurring remotely on your robot.

Starting the debugger is almost the same action as deploying code with GradleRIO.  Execute the “debug” command instead of “deploy”:

debug_remote_menu

This command will build and deploy code in debug mode which will configure the RIO to communicate back to your debugger.  Visual Studio Code will also switch into debug mode (as indicated by the Debug icon in the activity bar on the left edge of the window).

Breakpoints

The first important concept in remote debugging is the setting of “breakpoints” in your program.  A breakpoint is a location in your program that you want to watch.   When your robot’s thread of execution reaches that point, the program will freeze and your debugger will come alive.

Inline breakpoints

To create a breakpoint, click to the left of the line numbers in your program.  Below, we’ve created a breakpoint on line 51 of the teleopPeriodic method, indicated by a little red dot:

debug_remote_normal_breakpoint.png

Start the Driver Station software and enable teleop mode.  The normal execution of a robot program is that the RIO will execute teleopInit once and then start executing teleopPeriodic.   When the RIO reaches the breakpoint on line 51, it will pause execution as below:

debug_remote_debug_mode

There is a lot of information going on in this window:

  • In the upper left sidebar you see all the local variables of the teleopPeriodic method, There’s also the “this” variable that you can expand to see all the Robot’s instance variables.
  • Below the Variables section is the Watch section, which lets you add arbitrary expressions to be evaluated.
  • In the lower left of the sidebar is the Call Stack, which tells you what method called your current method, and what method called that method, etc.  The call stack actually lists all the Java threads currently running on the RIO, but you may have to stretch out the window to see them all.
  • Below the Call Stack, there is a list of Breakpoints.  In the above illustration, you would need to collapse the call stack to see the breakpoints.  You can edit or enable/disable breakpoints here.
  • Above the editor window is the debug toolbar:

debug_remote_toolbar.png

The “Continue” tool will cause program execution to resume, until it reaches the next breakpoint.  The “Step Over” tool executes the next line of code.  “Step in” will drill into a method. “Step out”  pops out of the current method to the method in the call stack that called it.  At every step, you can watch the variables change.  You’ll be able to see the code go through “if” statements and loops.

Also, take a look at the “Debug” menu at the top of the window.  Particularly useful in the Debug menu are options to temporarily disable all breakpoints and then later enable all breakpoints.  Disabling breakpoints lets you perform normal robot operations for a while.  Then you can enable breakpoints to examine specific scenarios.

Conditional breakpoints

Note that in our above example, we encounter the breakpoint every single time we execute teleopPeriodic.  We could have put the breakpoint inside the “if” statement, in which case the breakpoint would stop only when the “slowMode” variable was true.

It is often useful to set “conditional” breakpoints that only fire when certain conditions arise.  The conditional breakpoint is indicated by a little red dot with an equals sign in it.  Create one by right-clicking to the left of the line number and specify “Add Conditional Breakpoint”.

For instance, below we have a  breakpoint on line 55 that only fires when both leftSpeed and rightSpeed are greater than 0.5.

debug_remote_conditional_breakpoint

Exception breakpoints

You can also specify that the debugger stops operation when an exception is thrown.  Look in the Breakpoints section at the bottom of the Debug sidebar and enable “Caught Exceptions”.  Exception breakpoints can be especially useful when you’re trying to diagnose unexpected exceptions.

Note that VS Code will break on all exceptions.  Other IDEs allow you to break on specific exception types.

Logpoints

A logpoint is like a breakpoint, but it merely prints a message out to the console instead of stopping.  This is like debugging with print statements, except that you can enter them in the debugger without having to recompile.  Create one by right-clicking to the left of the line number and specify “Add logpoint”.  Logpoints are indicated by a little red diamond.

You can cause logpoints to print out variable values by putting the variables in curly braces.  Below is a logpoint that will print out three variables:

debug_remote_logpoint.png

Examining program state

The Variables section of the debug sidebar will answer many of your questions about what’s going on inside your program.  Spend time exploring the local and instance variables to see what’s in the objects.  Familiarize yourself with the state of health programs so you can better spot error conditions.

The Variables section also allows you to change the values of variables.  Just double-click on any number, boolean, or String value and you can give it a new value.  This feature can let you test specific scenarios, such as “What will happen if my gyro returns a negative value?”.

If you are monitoring specific variables or variable expressions, park them in the Watch section.  They will be reevaluated whenever the program stops.  You can add expressions directly in the Watch section, or you can right-click on them in the code editor and select “Debug: Add to Watch”.

Debugging robot programs with Eclipse

The program on your robot is running within a Java Virtual Machine (JVM).  Remote debugging is possible because JVMs contain features to support it.  The mechanism for debugging is called the Java Platform Debugger Architecture (JPDA).    Visual Studio Code has an extension that connects to JPDA, but so does nearly every other Java development environment.  The debugging functions will be similar on other IDEs, but the user interface may be different.

Eclipse has an excellent built-in Java debugger.  The user interface is different from VS Code, but (in my opinion) it makes better use of you screen space.

debug_remote_eclipse_3.png

Eclipse’s Gradle plugin allows you to execute the GradleRIO deploy task.  Enabling remote debugging is a slight variation on the deploy task.

  1. Go to the Gradle Tasks view and find embeddedtools > deploy.  Right-click on the deploy task and select “Open Gradle Run Configuration”.
    debug_remote_eclipse_1a.png
  2. The Run Configuration dialog will pop up for the “deploy” task.
    debug_remote_eclipse_1b
  3. Click on the Arguments tab and add the debugMode project property.  Then hit the OK button to save.
    debug_remote_eclipse_1c
  4. Next, you’ll need to set up a Remote debugging configuration.  From the Run menu, select “Debug Configurations…”
    In the Debug Configuration dialog, add a new entry under “Remote Java Application”.
    debug_remote_eclipse_2
    Specify a host address that will connect to your roboRIO (either 10.te.am.2 or 172.22.11.2) and set the port number to 8349.

To do remote debugging in Eclipse, you will first deploy the code in debugMode using your new run configuration.  Then, you will attach to the remote process with your new debug configuration.

Debugging robot programs with IntelliJ

IntelliJ also an excellent Java debugger.  It is built-in, no extension needed.  The function and user interface is similar to Eclipse.

debug_remote_intellij_3

To set up remote debugging in Intellij:

  1. From the Run menu, select “Edit Configurations…”
  2. Create a Gradle configuration with a task of “deploy” and arguments turning on the debugMode
    debug_remote_intellij_1
  3. In the same Run/Debug Configurations dialog, create a new Remote configuration for port 8349 and for a host address that connects to your roboRIO.
    debug_remote_intellij_2

To do remote debugging in Intellij, you first deploy the code using your new deploy configuration.  Then, attach to the RIO using the new Remote configuration.

When not to use the Debugger

There are times when the debugger isn’t the right tool.   Robots operate in real-time, so freezing time disconnects them somewhat from real-world processing.    For instance, if you are debugging while motors are moving, stopping the action will the change the physics of your situation.  If you stop a command that has a timeout, the timeout may expire while you’re staring at the code, which change the robot’s behavior.  If you’re investigating at problem related to real-time interactions, you may choose to set logpoints or to use printing, logging, or ShuffleBoard instead.

Overall though, I hope this exercise has sold you on the use of the debugger.  It will be a tremendously useful tool for problem solving.  All serious programmers should learn to use the remote debugger.

Further Reading:

Tutorial

IntelliJ with GitHub

Programming as a team introduces special challenges. You’ll need extra communication to keep everyone productive, and additional tools to keep from losing work.

Professional environments use Revision Control Systems to store the code, communicate the changes, and keep people from overwriting each other’s work.  FRC programming teams should also use Revision Control.

Probably the most popular revision control system right now is git, a distributed version control system created by Linus Torvalds, the same guy who created Linux. You can use git from the command line, or from within development environments such as Eclipse, IntelliJ, and Visual Studio Code.  GitHub is a web-based hosting service for git, and the GitHub corporation is a FIRST sponsor.  All programming mentors and students can get free GitHub accounts, and FIRST teams can get upgraded Team Accounts.

To say that git is “distributed” means that every programmer will have a copy of the code, along with the history of the changes.  There is also one remote repository of the code out on the internet. Programmers will occasionally pull changes from the remote repository to their local copy and occasionally push their own changes up to the remote repository.  In this way, everyone eventually has the same code and the same history.

Combinations of the code files are called “commits“, and the word “commit” here is both a noun and a verb.  Committing your changes creates a commit that you can retrieve later.

OK, I know that that was a lot of information.  Honestly, git is a really deep subject, and companies that use it develop really complicated methodologies for its use.  I do not recommend that FRC teams try to use everything in the git toolkit, or try to emulate commercial practices.  Especially at first.  Instead, let’s lay out the minimal functions.

Installing and configuring git

IntelliJ provides an excellent user interface to git, much better than the UI in Eclipse or VS Code.  However, the git package is separate from IntelliJ.  You must install it on your laptop.  Instructions are at:  https://git-scm.com/ .

You should configure git to know who you are.  This information will be added to the repository very time you commit.  Open up a terminal window and execute the following:

git config --global user.email "myEmailAddress@whereever.com"
git config --global user.name "My real name"

Cloning an existing repository

Suppose that there is a repository on GitHub that you’d like to download to your laptop.  Making a local copy is called making a clone.

Consider the code repository at:  https://github.com/firebears-frc/testrobot0.  Go ahead and visit that page in a browser.  Press the green button labeled “Clone or Download” and then press the little clipboard button.  This will copy the repository’s formal URL into your clipboard.

vsc_git_clone

Now go to IntelliJ:

  1. From the main menu select File > New > Project from version control > git
  2. Paste your git URL into the “Clone Repository” dialog.  Click “OK” and open the new project in the current window.
  3. A dialog may appear asking if you want to import a Gradle project.  You do.
    If the dialog gets lost, open your project in the Project tool window.  Right-click on the build.gradle file and select “Import Gradle Project”.

At this point you now have a clone of the repository on your machine.  You won’t be able to push changes up to the remote repository unless the owner has granted you permission, but you can read, edit, and deploy this code to the robot.

Creating a new repository

Suppose you have a robot project on your local machine that has never been under git control, but you’d like to upload it into GitHub.   Open your project in IntelliJ and then:

  1. From the menu select VSC > Import into Version Control > Share Project on GitHub.
  2. Log on with your GitHub account:
    intellij_github_login.png
  3. Specify the repository name and description:
    intellij_github_share
  4. Make the initial commit of all your files:
    intellij_github_commit_1
  5. Now go to your browser and visit the page on https://github.com for your new repository.  You should now see all the files listed on the web page.

Note that this process has initialized your local project to be tracked by git.    You’ll notice that there is now a “Version Control” tab at the bottom of the window that will open the Version Control tool window.  The “Local Changes” tab will show files that have been added or modified since your last commit.

intellij_github_vc.png

Also notice the branch indicator in the lower right corner of the screen.  This will be used when you start managing multiple branches in your repository.

Committing changes to the code

From now on, when you add files, delete files, or modify files, git and IntelliJ will keep track of how your code differs from the most recent commit.  The Local Changes tab keeps track of what has changed.  When you are ready to make a commitment, select the files, right-click, and select “Commit”.

intellij_github_commit_2

Type in a commit message.  Try to write informative messages, since you and others will be reading this later.  Good messages say things like “Updated autonomous commands for new encoder” or “Code changes after first regional”.   Bad messages contain jokes or gibberish or say things like “changed stuff”.

intellij_github_commit_3

After entering a useful message, hit the “Commit” button.  This will commit your changes locally, but will not yet push those changes upstream to Github.

Pulling changes back from the repository

Suppose someone else has made changes to the code and pushed them up to the remote repository.  You’d like to fetch those changes and merge them into our code.  This is called doing a pull from the remote.

You can pull at any time, but it is usually best to commit your code locally before pulling.  That is to say, commit the code but don’t push it up yet.  Follow the directions in the previous section to do the commit.

To pull down changes, select from the main menu:  VCS > Git > Pull.   The best case scenario (which is usually what happens) is that upstream changes will be seamlessly added to your code and everything will work perfectly.

One thing that might go wrong is that the changes pulled in will invalidate or undo something you are doing.  You should always look over the incoming changes.

The worst case scenario is that someone else will have changed files that you are working on, and you will need to “merge” changes.  The Conflicts dialog will show which files are in conflict:

intellij_github_merge_1

For each conflicting file, you will have three options

  • Accept Yours : ignore all changes in the remote repository and stick with your changes.
  • Accept Theirs : overwrite this file with the file from the remote repository.
  • Merge: Manually decide how the conflict will be resolved.  This involves picking out individual changes will be copied from your branch or from the remote branch.  If neither change looks right, you can edit text in the middle panel any way you like:intellij_github_merge_2.png

After you’ve modified a conflicted file and saved the changes, go back to the Local Changes view.   After merging all the conflicts, perform another “Commit”.

Pushing your changes up to the repository

If you are ready to release your changes to the rest of the group, you can push your commits up to the remote repository.  Use the menu options VCS > Git > Push.

Synching with the remote repository

There’s an important discipline that everyone must develop with respect to the remote repository, which is that you should always pull in remote changes before pushing up your own.  If there are incoming changes, then you must recheck the merged code to verify that it is OK.

With multiple programmers, you should perform the following steps manually:

  1. Commit your changes locally.
  2. Pull remote changes, and deal with any merge conflicts.
  3. Verify that the merged code compiles correctly and that the code works correctly.  If there are any problems, fix them and then go back to step 1.
  4. Push all commits to the remote repository.

Further Reading:

Tutorial

Creating Java Programs with IntelliJ

Creating GradleRIO FRC robot programs in IntelliJ is quite easy.

Step 0: The prerequisites

At this point you should already have installed Java and set up IntelliJ.

You must be connected to the internet the first time you build the project.  After the first build, you can build in offline mode.

Also, you should obtain and run the WPILib one-step installer (available at the beginning of the 2019 season).  Even if you’ll be developing with InteliJ,  you’re likely to need the tools and project templates included in this package.

Step 1: Create a new Robot Project

There are currently several ways to create a basic WPILib robot project:

  • Create a new robot project with VS Code using the WPILib extension.
  • Create a project with RobotBuilder.  You will need a recent version of RobotBuilder that generates GradleRIO projects.  The 2019 software release will contain all new tools, including RobotBuilder.  Or, you can build the latest version from GitHub.
    RobotBuilder creates a full command-based project, so it may be more complicated than what is described in Step 3 below here.
  • Uncompress a copy of the Quickstart.zip file and make a copy of the “java” directory.  Rename the directory to whatever you like.

Now, whichever method you use, add an empty directory called “vendordeps”.   Your project should now look like this:

intellij_program_files

Inside IntelliJ, open the File menu and select File > Open.  Select your project root directory and hit the “OK” button. The “Import Gradle” dialog will appear. Hit “OK” again and open the project in the current window.   The “Gradle” tool window on the right side of the window should populate with all the GradleRIO tasks.

Third party dependencies

If you intend to use any third-party software, you will need to add some JSON files to the vendordeps directory.  The best way to get these files is to get the official installers.  Examples of third party packages include:

Picking a JDK

By default, your IntelliJ project will use your JAVA_HOME environment variable to determine where Java is stored on your laptop.

However, it is possible to have multiple Java Development Kits (JDKs) installed on your laptop.  If you need pick a specific JDK (which IntelliJ will refer to as an SDK), you should select File > Project Structure > Project  from the main menu.  From the Project Structure dialog you can configure a new SDK or configure a previously defined SDK.

Set your team number

Open the build.gradle file and modify the team number setting, probably around 17:

intellij_program_gradle.png

First Build

Open the Gradle tools window.  You should see your new project listed.  Open your project’s icon and select the “build” folder and then double-click on the “build” task.  This should successfully build your new FRC Java project.

Step 3: Program to control one motor

If you started your program in RobotBuilder, you may already have mostly complete program.  If you started with the Quickstart example, your program is mostly just in one Robot.java file.  We can augment the Quickstart example to control a motor.

Back in the Project tools window, double-click on that Robot.java file.  This is your main Java program for controlling the robot.

All of the code in Robot.java is useful, but for simple programs it is optional.  To keep this tutorial really simple, we’re going to delete everything except robotInit() and teleopPeriodic().   Also we’re going to tweak the “import” statements a bit:

intellij_program_edit

For this example, assume we have a joystick connected to drivers’ station and a motor controller connect to the roboRIO.  We’ll create two variables around line 7 to represent them:

Joystick stick;
SpeedController motor;

Now we’ll instantiate the objects inside the robotInit() method:

public void robotInit() {
    stick = new Joystick(0);
    motor = new WPI_TalonSRX(2);
}

For my example, I’m using a Talon SRX connected to CAN ID 2.  If you’re using any other motor controller, just change the line to reflect your hardware.

Next, change your teleop mode so it reads the joystick, and sets the speed of the motor:

public void teleopPeriodic() {
    double speed=stick.getY();
    motor.set(speed);
}

The getY() function tells us how for forward or backwards the joystick has been pushed.  The speed value will be a number between -1.0 and 1.0.

From the Gradle tools window you can now build or deploy the program.


Step 4:  Drive your robot

Start up the FRC Driver Station software.  You should see green bars next to “Communications”, “Robot Code”, and “Joysticks”.  Also, you should see your correct team number.  If the team number is wrong, click the Gear icon on the left side to get to the setup panel.

vsc_program_driver

Click the “Enable” button to initialize teleoperated mode.  You should now be able to drive the motor with the joystick.

Consider for a moment what’s going on with the code.  The robotInit() method was called once, and then teleopPeriodic() is being called 50 times a second.  Each call of teleopPeriodic() reads the joystick and passes that value into the motor.

Further Reading:

Tutorial

Installing IntelliJ

IntelliJ is a sophisticated professional development environment for Java.  It is produced by the Jetbrains company, which also produces Android Studio, CLion for C++ development, and PyCharm for Python.  Although IntelliJ is a commercial product, there is Community Edition that is free to use.

FRC robot programs will be built using GradleRIO, which can execute from inside any development environment, including IntelliJ.

Step 0:  Install prerequisites

You must install Java.  Even if you will be developing in C++, you’ll need Java installed to run IntelliJ and GradleRIO.  You should define your JAVA_HOME environment variable to point to your JDK installation.  Often setting JAVA_HOME is considered optional, but I have seen many strange situations resolved after this variable has been properly set.

You should obtain and run the WPILib one-step installer (available at the beginning of the 2019 season).  Even if you’ll be developing with IntelliJ,  you’re likely to need the tools and project templates included in this package.

It is highly recommended (though not strictly required) that you also install git, instructions for which are at: https://git-scm.com/ .

Step 1: Download and install IntelliJ

IntelliJ is available for Windows, Macintosh, and Linux.  Download the installer from https://www.jetbrains.com/idea/download.  Select download on the “Community” version.

intelij_install_0

Run the installer, if possible as the Administrator.  After installation, you’ll probably have to reboot your machine.

intelij_install_1

The first time you start IntelliJ, it will go through setup dialogs.  You can safely take all the default options.

IntelliJ is a big, sophisticated program, but it’s pretty user friendly.  Text editors will appear in the center of the window.  The tabs on the edges of the windows open up “tool windows” on the sides.

intellij_install_windowTo get you started:

  1. The Project tool window lists all the files in your project.  Double-click on them to pop up an editor.
  2. The Structure tool window summarizes the contents of the file you are editing. Double-click on anything to navigate to that item.
  3. The Gradle tool window lists all the tasks that can be executed when building your project.  Double-click to execute.

Step 2: Build a simple project

Creating  complete robot programs in IntelliJ is a lesson I’ll defer to another tutorial.  For now, you can download an existing project and verify that IntelliJ can build robot programs.

  1. If you start with the startup dialog, Select “Check out from Version Control” .  If you are already in the IntelliJ window, select File > New > Project from Version Control > Git.   Give the URL value of: https://github.com/firebears-frc/testrobot0.git and then hit the Clone button.
  2. Open the “Project” tool window on the left of the screen.  Expand the testrobot0 project to see all the files.  Right-click on the build.gradle file to get a popup menu.  Select the “Import Gradle project” item, which will likely be the last item on the list.
  3. Importing will take another minute.  After this “Gradle” tool window will become available on the right side of the window.
  4. When importing is done, you should also see testrobot0 in your Gradle tool window.  Open this item and then open “build”.  Double-click on the “assemble” task.  This should successfully compile the program.
  5. Under embeddedtools, double-click on the “deploy” task to deploy the program to your robot.  This will fail if you aren’t connected to a roboRIO.  But, no harm will have been done.

Further Reading:

Tutorial

Debugging: Shuffleboard

Shuffleboard is a customizable dashboard that provides amazing visibility into your robot. You can set up many graphical widgets on the Shuffleboard window, each of which displays information from the robot.  For instance you can create widgets for current motor speeds, air pressure, or the output of sensors.  The Shufflebord window can have multiple tabs to organize the widgets.

You can use Shuffleboard to provide real-time information while driving in a competition, but it’s also very useful while developing and testing your hardware and software.  It can definitely help you out when you’re trying to answer questions like “Are the actuators and sensors working correctly?” or “Why doesn’t it behave the same as it did yesterday?” or generally “What’s really going on inside the robot?”

There are at least three ways to start up this tool.  Within the driver station software, you can specify Shuffleboard as your “Dashboard Type”, which will cause shuffleboard to start up when you start the driver station.  You can also start it from the Visual Studio Code Command Palette with the command “WPILib: Start Tool”.  A third way to start it up is to start the program directly from the “tools” directory in your FRC install. (e.g. C:\Users\Public\frc2019\tools).

The default configuration for Shuffleboard has two tabs listed at the top:  SmartDashboard and Livewindow.

The SmartDashboard Tab

First, a bit of history:  SmartDashboard is a dashboard similar to Shuffleboard, but it is older and has fewer features.  Shuffleboard expands on the programming interface for this older program.   Many of the programming examples that come with WPILib will contain code that sets up widgets on SmartDashboard.  In the same way, these calls will create widgets in Shuffleboard.

The SmartDashboard tab is the default destination for custom widgets created within your robot program.

debug_shuffleboard_smartdashboard

The widgets you can add to this tab fall into two categories:  raw data and Sendable objects.

Raw Data Widgets

You can display numeric, boolean, or text values directly to Shuffleboard.

SmartDashboard.putNumber("Rangefinder dist", rangeFinder.getRangeInches());
SmartDashboard.putBoolean("Shooter", shooter.readyToFire());
SmartDashboard.putBoolean("Target visible", visionSystem.onTarget());
SmartDashboard.putString("Intake status", intake.getStatus());

The four widgets created above will not update automatically. You must put out the values again when you want them to change. You can update them in a periodic function, such as by putting the rangefinder line into your robot’s robotPeriodic() method or a subsystem’s periodic() method.  Or, you can change them as needed.  For instance, you might use a periodic method up update the rangefinder distance every 20 milliseconds.  On the other hand your Intake subsystem might contain code that updates its dashboard status when the status actually changes.

Once the widgets show up on the Shuffleboard you can modify their format type.  For instance, a boolean widget can be text or a colored box.  A number widget can be just text or it could be a dial or graph.

The graph format can be especially when debugging. Imagine two graphs representing two drivetrain motors; you could compare the two graphs when considering if the motors are getting correct signals.

debug_shuffleboard_graphs.png

In general, raw data lets you answer basic debugging questions about the status of robot components.

Sendable Data Widgets

Many WPILib objects implement the “Sendable” interface, which allow those objects to communicate over the Shuffleboard’s network table interface.  Most motors, actuators, and sensors are sendable.

SmartDashboard.putData(leftMotor);
SmartDashboard.putData(rangeFinder1);
SmartDashboard.putData(rangeFinder2);
SmartDashboard.putData(grabberSolenoid);

The magic of sendable objects is that they update their data automatically.  You only need to call the above lines once, such as in your robot’s robotInit() method or in a subsystem’s constructor.

The visual format of each sendable widget is specific to its object.  For instance, the motor’s widget is a number slider that tells the current output of the motor.  For some debugging scenarios, you might be better off sending the motor output as raw data, so you can view it as a graph.

Note that you can optionally add a name value to the widget:

SmartDashboard.putData("Forward rangefinder", rangeFinder1);
SmartDashboard.putData("Backwards rangefinder", rangeFinder2);

More objects are sendable than you might expect. For instance all Commands are sendable and create a button widget that lets you trigger the command.  Subsystems are sendable and create a widget that tells you which Commands are currently running on them.

SmartDashboard.putData(Robot.driveTrain);
SmartDashboard.putData("Fire Shooter", new FireShooterCommand());
SmartDashboard.putData("Turn 90 Degrees", new TurnCommand(90));
SmartDashboard.putData(Scheduler.getInstance());

The LiveWindow Tab

LiveWindow shows each subsystem and the child components within them.  In teleop and autonomous modes the LiveWindow shows what the components are doing. However, if you enable Test mode on the driver station, this tab will come alive and allow you to manipulate the components.  This allows you to test (and debug) robot components without writing any special code.  Does your newly installed motor really work?  Enable test mode and you can run it at any speed.

debug_shuffleboard_livewindow

LiveWindow comes for free; no code changes are necessary to create it.  However, to get the best value out of this tool, you should let the dashboard know which components are children of which subsystems.

If you are creating your components within the subsystem code,  you can designate the child status with addChild() calls.  Note that the first argument to addChild is the text name for the component.  If you do not give a name, the LiveWindow will give you default names like “Spark[3]”.

public DriveTrain() {
    leftMotor = new Spark(0);
    addChild("Left", leftMotor);
    leftMotor.setInverted(false);
    rightMotor = new Spark(1);
    addChild("Right", rightMotor);
    rightMotor.setInverted(false);
    rangeFinder = new Ultrasonic(2, 3);
    addChild("rangeFinder", rangeFinder);
}

If you are creating your components elsewhere, such as in a RobotMap class, you can still designate the child-relationship by giving the component a name and subsystem name:

intakeMotor=new Spark(3);
intakeMotor.setName("Intake", "intakeMotor");

Another absolutely genius feature of LiveWindow is that it lets you configure PID subsystems in real time.  Configuring PID without this feature involves a lot of trial and error, mixed with constant recompile cycles.  With LiveWindow you can dial it in in real time, and then copy the chosen parameters back into your code.

Setting up a Custom Debug Tab

The primary users for Shuffleboard are the robot drivers.  At the beginning of a match, the drivers will fire up their driver station and they will want to see only the widgets that assist them.  Programmers are secondary users of Shuffleboard, so we shouldn’t clutter up the main Shuffleboard screen with our diagnostic widgets.  For this reason, we may shift our widgets off to secondary tabs, or we may configure them to go away when we aren’t debugging.

You can write code that sets up new tabs and positions widgets within them.

Consider that the widgets described above look like long-term decisions.  You set them up and assume that you will always need them.  When debugging, we often create temporary code just for the purpose of answering certain questions.  You could create temporary code for widgets, but they may pop up and get in the way of your permanent widgets.  It would be nice to have a designated spot to put the temporary stuff.

A neat way to address this need is to programmatically create a “Debug” tab where all your temporary widgets.  Custom tabs can be created in your code:

ShuffleboardTab debugTab = Shuffleboard.getTab("Debug");

Widgets can then be added to the tab with a name (e.g. “Vision Dist”) and a default value.  The “withWidget” method declares the widget’s format type.  Number widgets can be of type “Number Bar”, “Number Slider”, “Graph”, “Voltage View” or “Text View”. Boolean widgets can be of type “Boolean Box”, “Toggle Button”, “Toggle Switch”, or “Text View”.  String widgets can only be “Text View”.

 NetworkTableEntry visionDistWidget = debugTab
        .add("Vision Dist", 0.0)
        .withWidget("Graph")
        .getEntry();

Values can then be set into the widgets like this:

visionDistWidget.setNumber(vision.getTargetDistance());

Values can be set throughout your code:

debug_shuffleboard_custom_code.png

Note that in this example, we set up all our widgets in the Robot class.  A better pattern might be to create the debugTab variable in the Robot class, but then create the debug widgets inside the subsystems and commands.

The above code will generate widgets on a custom tab on the Shuffleboard window:

debug_shuffleboard_custom_tab

Further Reading:

Tutorial

Debugging: print statements and logging

Debugging is the process of figuring out why software isn’t doing what it should, and then fixing it so it behaves better.

Computer programmers always spend more time debugging code than they do writing it in first place. It is important to build up your skills in debugging code, whether the problem is in your own software or in code written by others.

Strangely, there isn’t a lot of literature available on this subject, and practically no formal education on debugging software. There should be more study and more formal methodologies. At least, all programmers should know the general techniques used by others and should learn the tools that are available.

Formalizing the questions

Sometimes debugging is easy. You see the problem immediately, or after a minute’s thought. However, if the problem has taken more than a couple minute’s consideration, you should start to specify the questions you need answers to. Often it helps to actually write these questions.  Really.  Write down the questions as if you you’re posing them to some third party.

Typical questions are:

  • Exactly how do I reproduce this problem? What is the negative scenario (where the problem occurs) and what is a positive scenario (where there is no problem)
  • Where was the program executing when things went wrong? How far into the program did we get? In what routine did the problem occur, and what was the path to get to that routine?  Did the Command I’m working on even execute?
  • What is the state of the data at the time of the problem? What does the data look like in positive scenarios? Why isn’t my Command ever finished?  What are the input and output values on my PID controller?

Debugging with print statements

The oldest and most common tool for debugging is to put temporary “print” statements into the code. You can print out variable values so you know the state of the data. Sometimes you just print little messages telling you where the program was executing, so you get a better idea of where the problem occurred.

A print statement in Java looks like this:

System.out.println("motor speed is " + motor.get());

When this statement executes, the text will print out on VS Code’s RioLog window and also on the Driver Station’s console window.  The printed text will also be available in the Driver Station’s Log File Viewer.  For basic debugging, the console may prove more useful than the Log File Viewer.

Print statements help answer questions like “Did a specific routine even execute” or “How did the motor speed vary during autonomous”.

Exceptions and Stack traces

When something goes seriously wrong in a Java program, the program may communicate this to other parts of the program by “throwing an exception”.  When an exception occurs, the program breaks out of the routine it is running and passes the exception to the routine that called it.  The exception is then propagated up the calling stack until one of the routines can handle it.  Handling the exception is called “catching” the exception.

When an exception is thrown, the program often prints out a “stack trace” to the console, which will show where the error occurred.  There is an example stack trace:

ERROR 1 Unhandled exception: java.lang.NullPointerException org.firebears.betaTestRobot2.subsystems.Board.setMotor2(Board.java:82) 
Error at org.firebears.betaTestRobot2.subsystems.Board.setMotor2(Board.java:82): 
Unhandled exception: java.lang.NullPointerException 
  at org.firebears.betaTestRobot2.subsystems.Board.setMotor2(Board.java:82) 
  at org.firebears.betaTestRobot2.commands.AutonomousCommand.execute(AutonomousCommand.java:29) 
  at edu.wpi.first.wpilibj.command.Command.run(Command.java:292) 
  at edu.wpi.first.wpilibj.command.Scheduler.run(Scheduler.java:224) 
  at org.firebears.betaTestRobot2.Robot.autonomousPeriodic(Robot.java:118) 
  at edu.wpi.first.wpilibj.IterativeRobotBase.loopFunc(IterativeRobotBase.java:225) 
  at edu.wpi.first.wpilibj.TimedRobot.startCompetition(TimedRobot.java:81) 
  at edu.wpi.first.wpilibj.RobotBase.startRobot(RobotBase.java:261) 
  at org.firebears.betaTestRobot2.Main.main(Main.java:20) 
Warning 1 Robots should not quit, but yours did! edu.wpi.first.wpilibj.RobotBase.startRobot(RobotBase.java:272) 
Warning at edu.wpi.first.wpilibj.RobotBase.startRobot(RobotBase.java:272): Robots should not quit, but yours did! 
ERROR 1 The startCompetition() method (or methods called by it) should have handled the exception above.

The above stack trace shows that an unexpected null value was encountered when the AutonomousCommand tried to set a motor value.

A stack trace is kind of a good news / bad news situation.  On one hand, you have a serious problem that shuts down processing.  On the other hand, you know generally what went wrong and exactly where it happened.

Learn to read stack traces and use them in your debugging.  Understand what the exception types are and how to interpret the calling stack.

Logging

The print statements described above are temporary changes to the program.  You should delete them after they have served their purpose.

Logging is a more formal process of printing out program state and execution.  If you identify things you want to monitor, you can leave the logging statements in your code, and then selectively turn on the ones you want to print.  Logs let you answer questions like “How often did our pneumatics fire?” or “What command was running just before we experienced a brownout?” or “Which autonomous program executed and what happened during that command?”

You can log items of different levels of importance.  Java supports seven levels of log severity, in this order:

  • SEVERE – serious failures
  • WARNING – potential problems
  • INFO – informational messages
  • CONFIG – configuration change messages
  • FINE – detailed debugging and tracing messages
  • FINER – more detailed debugging messages
  • FINEST – highly detailed debugging messages

Before you can do any logging, you must first create a Logger variable in each Java class:

private final Logger logger = Logger.getLogger(this.getClass().getName());

To actually create logs, call methods on the logger variable:

logger.fine("vision target acquired: angle=" + a + " : dist=" + d);

logger.config("PID controller values: " + p + "," + i+ "," + d);

logger.info("starting AutonomousCommand3 : gameData=" + gameData);

logger.warning("Air pressure is only " + pressure + " psi");

If you catch and handle an exception, you may want to log the problem, even if you’ve taken care of it.  The proper form is to add the exception to the log statement.  The following code will log a warning message, accompanied by the stack trace:

} catch (IOException e) {
    logger.log(Level.WARNING, "Failed to open connection", e);
}

Make good decisions about what to log. Don’t get carried way. Too many logs might create performance problems. Too many logs make it harder to find what you’re interested in.

Logged data will show up on the driver station Console and also within the Log Viewer.  For long term monitoring, the Log Viewer becomes extremely useful.   The Log Viewer can be used to reconstruct what happened during match.  Having some well chosen log statements may help you reconstruct what commands executed at what times, and what were the critical values of air pressure, elevator height, or motor speed.

Configuring your Loggers

Logging can be reconfigured to print out different things for different scenarios. For instance, you may decide that only messages of level INFO or higher get printed.  Later you can easily switch the level down to FINE, which will cause all the CONFIG and FINE messages to also print.  You can also specify different levels for different Java packages.  For instance, you may want the default log level to be CONFIG, but the autonomous commands log at the FINE level.  These levels are easy to set and easy to change later.

To configure your logging, create a file called “logging.properties” in your “deploy” directory:

debug_log_config.png

Here’s the content of our sample file:

frc.robot.handlers=java.util.logging.ConsoleHandler
java.util.logging.ConsoleHandler.level=ALL

frc.robot.level=CONFIG
frc.robot.commands.auto=FINE
frc.robot.subsystems.DriveTrain=FINEST

The first two lines just cause all messages in your project to be printed out to the console.  Line 4 sets the default logging level to CONFIG or higher for all loggers under the frc.robot package.  Line 5 causes all logging in the frc.robot.commands.auto package to log at the FINE level.  Line 6 sets the logging level of the DriveTrain subsystem to be FINEST.

To tell Java where your logging config file is, you must add one line to your build.gradle file.   You must add one jvmArg to the deploy / artifacts / frcJavaArtifact section:

frcJavaArtifact('frcJava') {
    targets << "roborio"
    jvmArgs = [ '-Djava.util.logging.config.file=/home/lvuser/deploy/logging.properties' ]
    // Debug can be overridden by command line, for use with VSCode
    debug = getDebugOrDefault(false)
}

Configuration specific behavior

Occasionally, you may need to do a little special processing that depends on the logging configuration.  Most of the time this is a bad idea, because logging should not change the behavior of your code.   On the rare occasions when this is necessary, you can detect the logging level as follows:

if (logger.isLoggable(Level.FINE)) {
    doubled=lidar.getDistance();
    logger.fine("Lidar distance = "+ d);
}

Further Reading: